Cyclical Metapopulation Mechanism Hypothesis:
Periodic Animal Population Cycles are Generated Via a Population-wide hormone cycle
Janne Miettinen | ResearchGate
Work-in-progress | Last update: Jun 22, 2026
Abstract
A cyclic population: a population exhibiting periodic multiannual population cycles.
A cyclic metapopulation: a metapopulation that incorporates one or more cyclic populations.
This hypothesis presents how all periodic multiannual animal population cycles are generated via a relatively simple endogenous biological mechanism: a population-wide hormone cycle. The multiannual hormone cycle cyclic populations’ physiological and behavioral trait-oscillations, and why they are in an entirely predetermined sequence. I.e. each phase of a population cycle (increase-peak-crash-low) is defined by its unique hormonal configuration.
Furthermore, this hypothesis details why these cycles exist: it is an evolutionary mechanism that A) catalyzes trait selection and B) improves the survivability of metapopulations via synchronized population-wide task prioritization. The mechanism is suggested to be a missing addendum to the evolutionary theory and something Darwin was looking into during his final years.
It is also explained here why the various environmental interactions, previously thought to be the cause of the cycles, are merely noise that affects the cycles yet do not generate them.
Introduction: The Multiannual Hormone Cycle
Periodic population cycles are highly common across the animal kingdom. For example, an estimated 70% of mammalian and fish species have these cycles. As an example of the persistence these cycles can exhibit, the statistic below is a 35-year portion of a virtually continuous 1000-year long budmoth metapopulation cycle.
Even though these cycles produce significant evolutionary benefits for metapopulations, the question of “what causes population to cycle?” has remained a mystery for over a century. No one has figured out what initiates or stops a population cycle or why do virtually all population cycles exhibit highly similar charasteristics that manifest as four unique phases of weighted physiological and behavioral traits, always proceeding in the same sequence regardless of the species, cycle period or the environmental factors (e.g. predators, pathogens, resources, density). Past hypotheses that rely on various environmental and intrinsic interactions have failed time after time to explain the cycles in a comprehensive manner. Therefore, taking a novel viewpoint to solving this centuries old enigma is an absolute necessity.
In fact, chronobiology finally allows for a comprehensive explanation to the mysteries of the population cycles:all periodic animal population cycles are generated by a population-wide hormone cycle. Similar to other reproductive cycles in biology – such as the estrous/menstual cycles – the multiannual hormone cycle is generated via an endogenous biological mechanism that can also be found in bacterial population cycles.
In its simplest form, the hormone cycle consists of four hypothalamic hormone* level oscillations that advance concurrently in an entirely predetermined sequence as listed below.
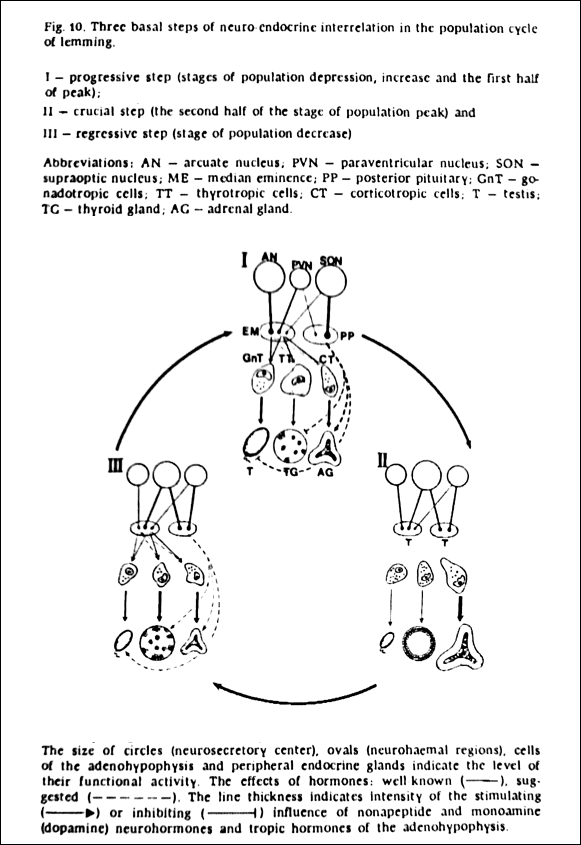
- Sex hormones: rate of sexual maturation & reproduction
- Growth hormone: physical size
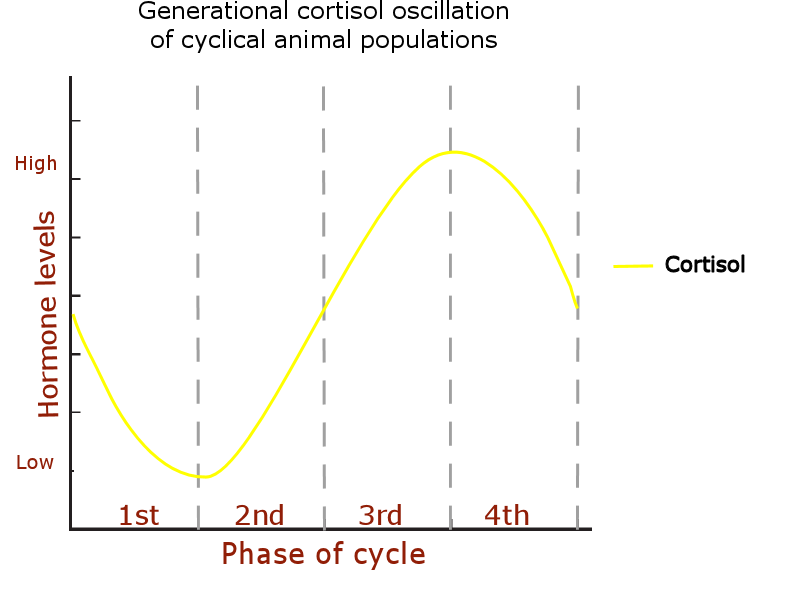
- Cortisol: immune response
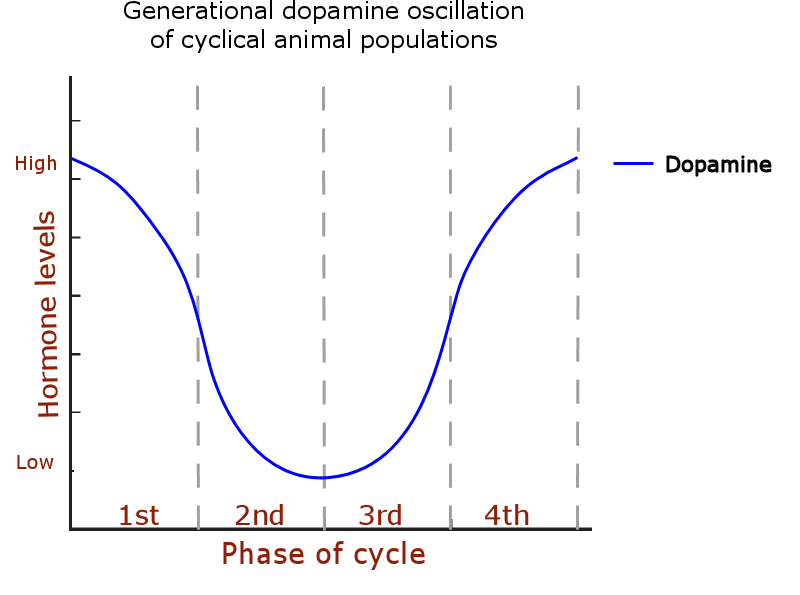
- Dopamine: sensitivity (physiological & emotional)
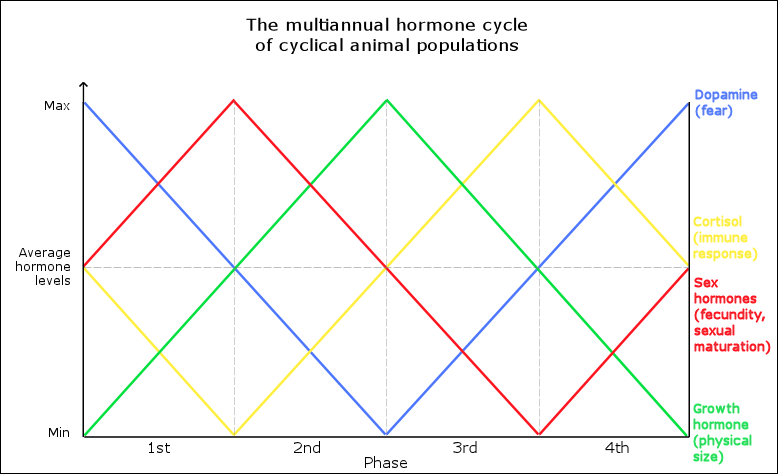
The cycle’s exact hormones vary by species, but primarily modulate 1) reproduction, 2) physical size, 3) immune response, and 4) migration & behavioral cohesion.
The graphic below visualizes how the mechanism generates the periodic population cycles once the initialization threshold is reached. The cycle begins with increasing sex hormone levels that causes rapid population growth, but during mid-cycle the population count begins to decrease once sex hormones go below average levels.
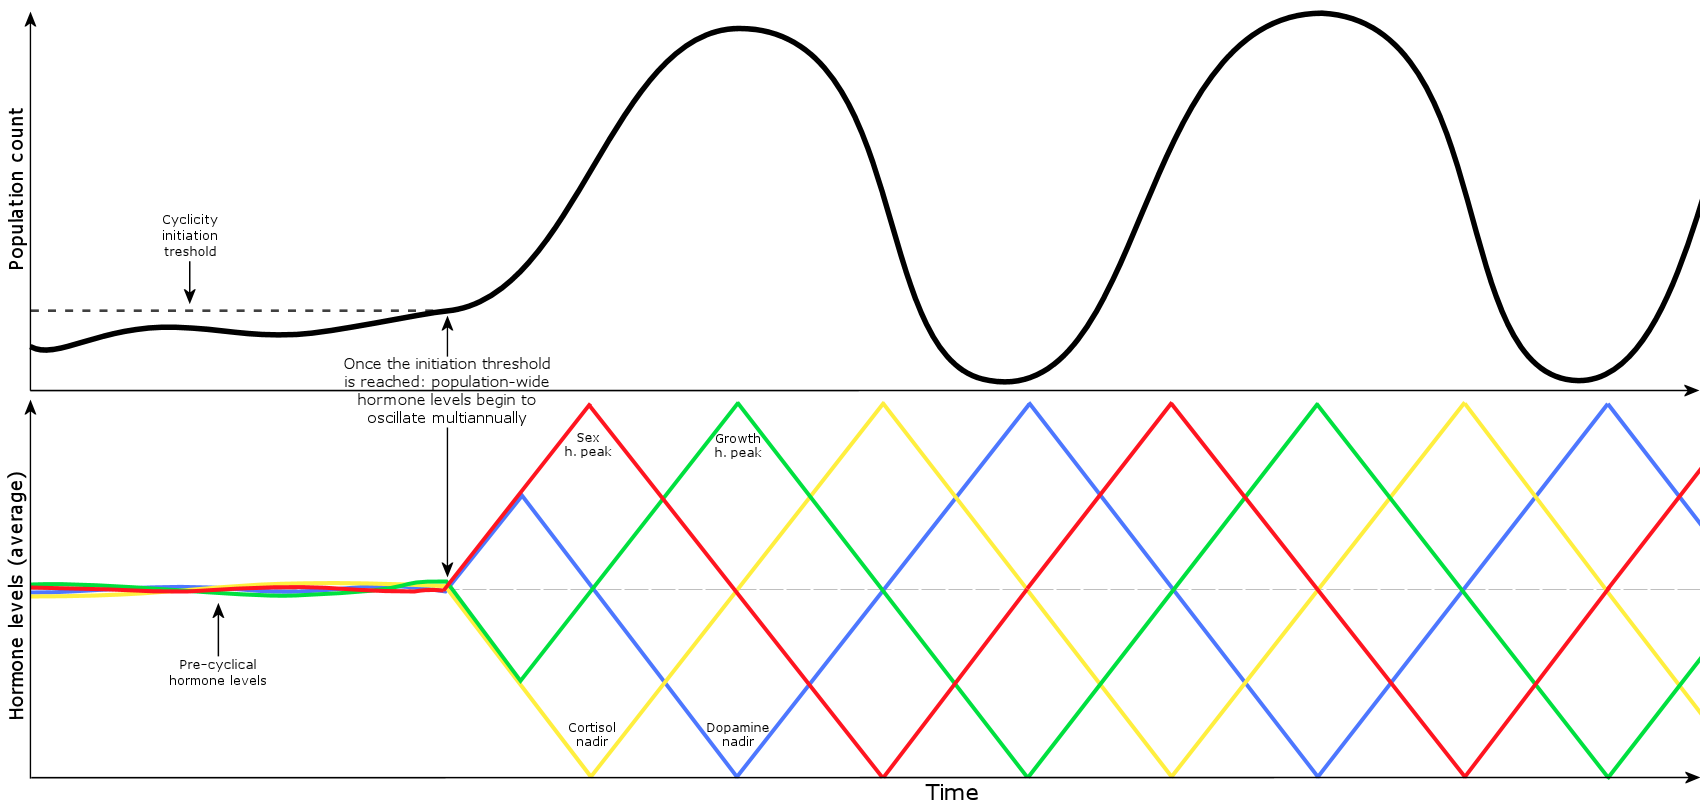
‘Cyclicity initiation threshold’ = the cycle initiates once a required number of females in a habitat achieve synchrony of their circadian rhythm.
Introduction: Active Resource Management & Colonization
The cyclical metapopulation mechanism provides significant evolutionary advantages for populations and metapopulations. The mechanism functions as a multiannual resource management and colonization loop [visualized below], where each cycle consists of four phases that are typically referred to as
1) increase, 2) peak, 3) crash, and 4) low.
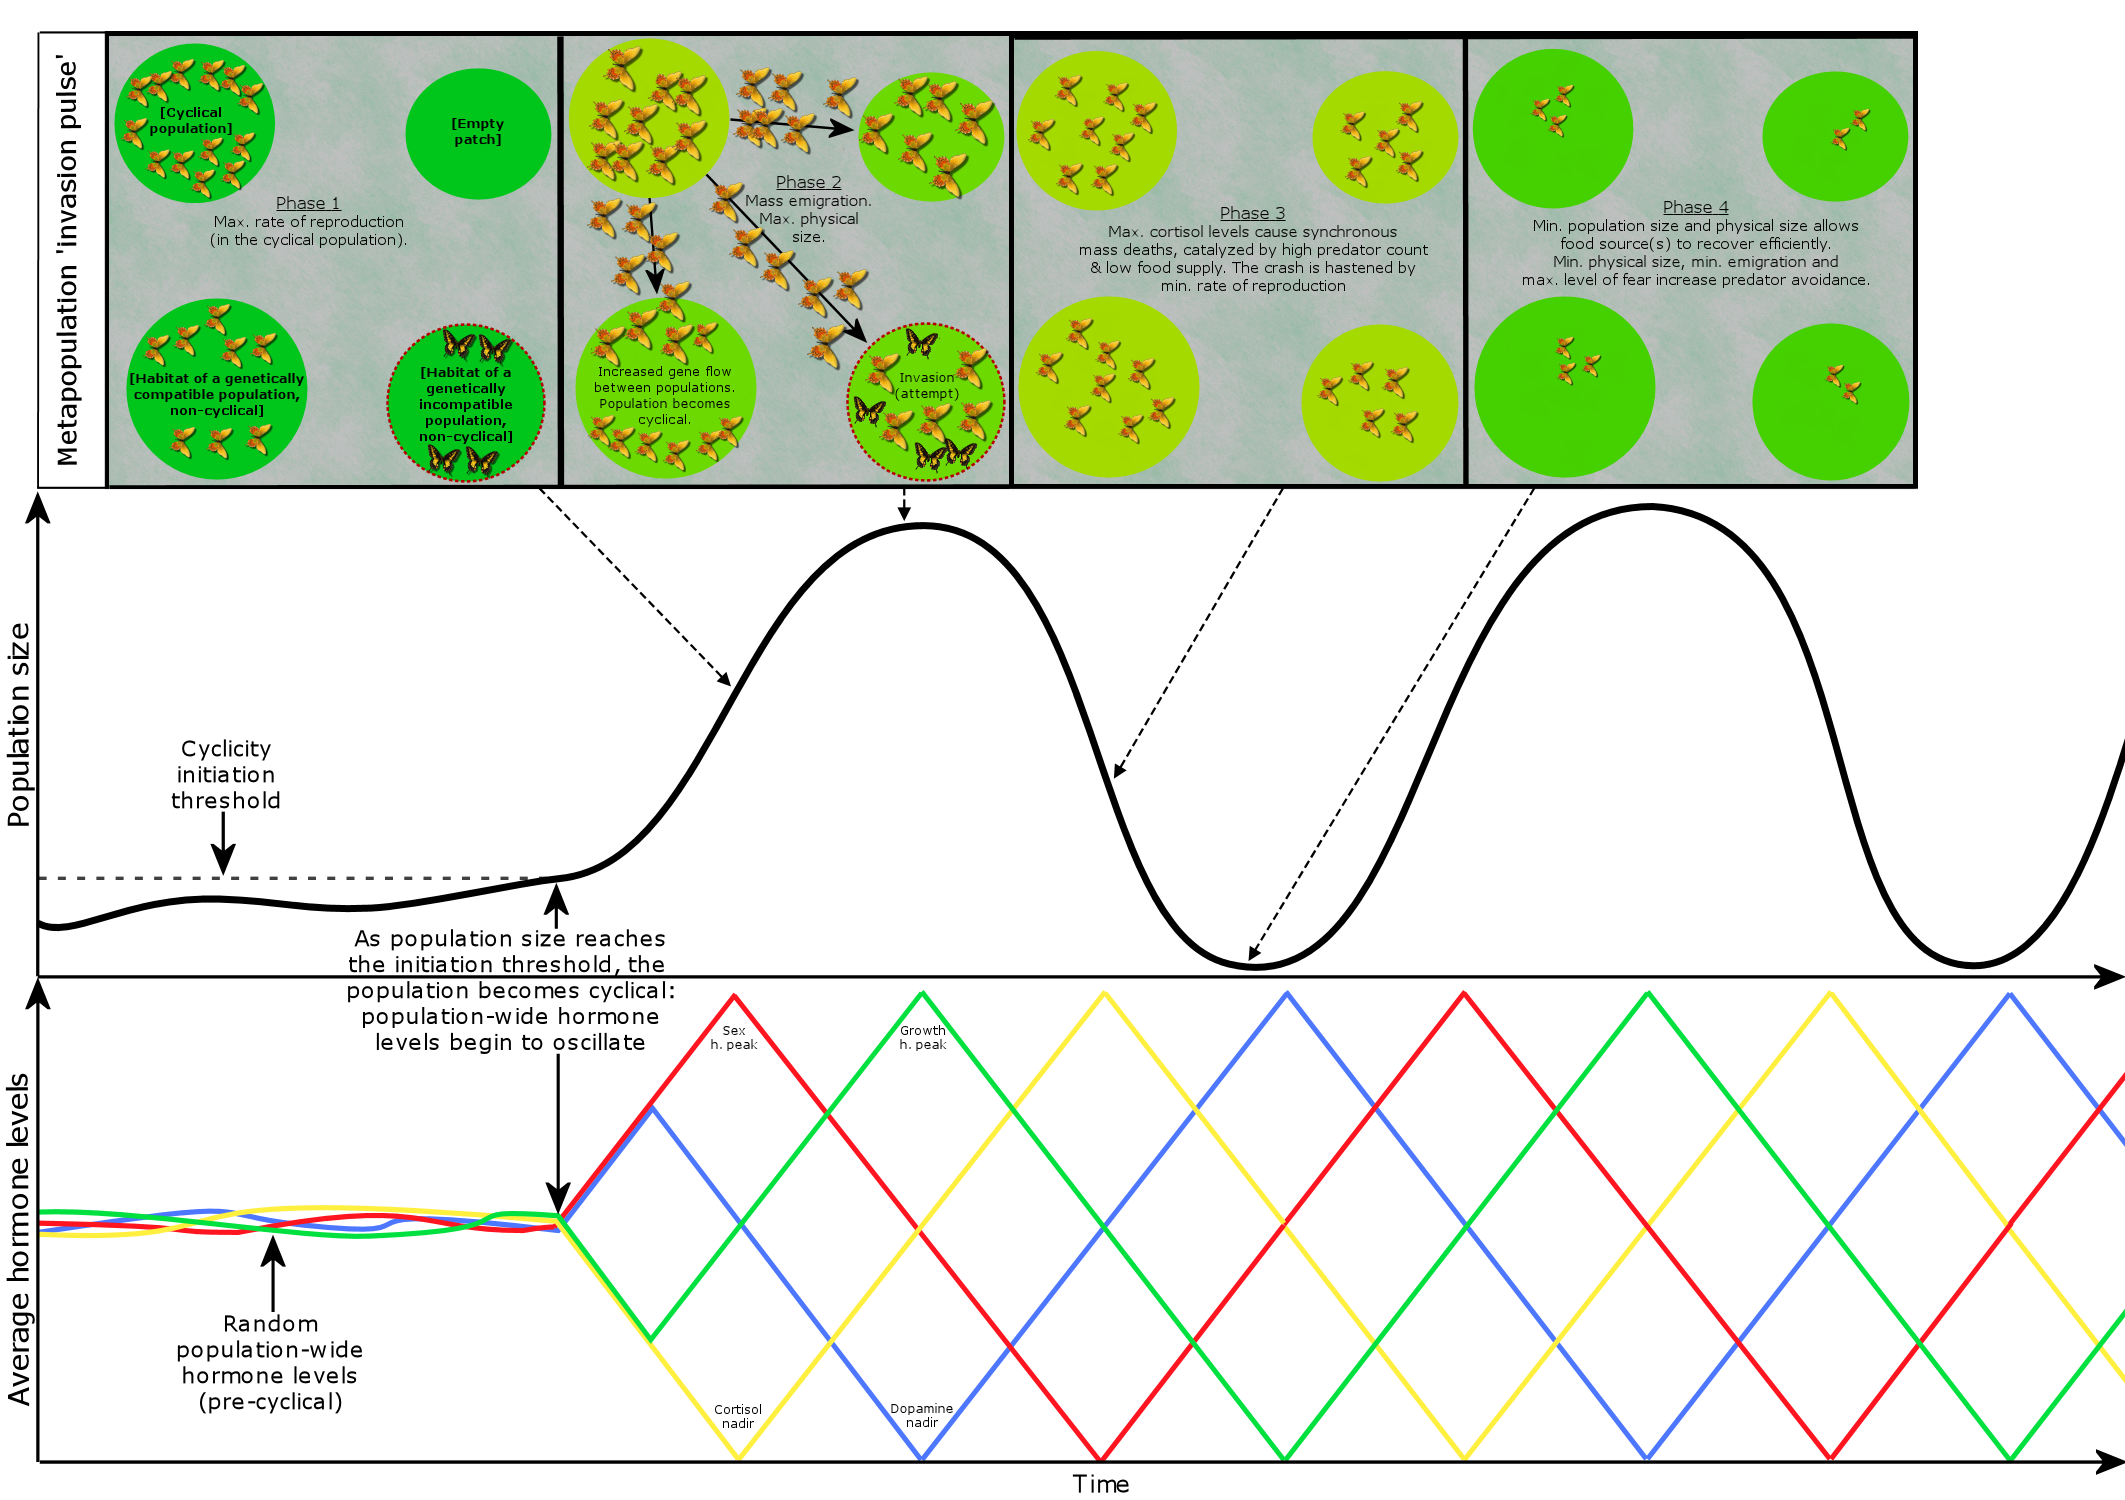
1) Increase phase: Maximum rates of reproduction (max. sex h.) and survivability (min. cortisol) result in a rapid population expansion.
2) Peak phase: Population size peaks while physiological and behavioral traits are optimized for emigration and seizing habitats, i.e. max. physical size and mass (max. growth h.) with the exception of avian species having smaller body size but larger wings for increased migration range, and increased tendency for aggression and low levels of fearfulness (min. dopamine). Migration activity peaks as animals emigrate outwards to expand and condense the metapopulation:
A) If encountering empty habitats -> form new colonies in order to increase the size, reach and density of the metapopulation.
B) If encountering colonies of genetically similar species -> increases the metapopulation’s gene flow, decreases the likelihood of inbreeding, and initiates/synchronizes the multiannual cycle in the colony.
C) If encountering colonies of genetically incompatible species -> the emigrants may try to infiltrate and seize the habitat.
3) Crash phase: Minimum rates of reproduction and slow sexual maturation (min. sex hormones) and low survivability (max. cortisol) cause the population count to crash, which allows the primary food sources to replenish in order to support the next cycle’s rapid population expansion. “A path analysis, on the vertebrate herbivores, shows that 92% of the variation in cycle length is explained by food-plant longevity and that body mass adds little to this.” The slower rate of maturation results in a longer developmental period, which enhances adaptation in the immigrants’ new environments. If a population goes extinct after the crash, the next cycle’s colonization phase may recolonize the habitat.
4) Low phase: Physical size of animals is at a minimum (min. growth h.) to allow the primary food sources to continue replenishing. The rates of reproduction and survivability begin to increase. Suboptimal habitats are abandoned in favor of optimal habitats, which supports the continuity of cyclicity in optimal habitats. High dopamine levels increase physiological and behavioral sensitivity, resulting in increased rates of epigenetic adaptation that is especially beneficial for the new immigrants. High level of fearfulness (max. dopamine) and small physical size increase predator avoidance, limiting the recovery of the predator populations. Furthermore, the crash and low phases leave the predator populations to starve, or even cannibalize, and to possibly abandon the area in search of food.
—> Endpoint of phase 4: A new cycle begins immediately after the 4th phase ends if the ‘cyclicity initiation threshold’s’ conditions are met.
Alternatively, cyclicity stops if the population cannot sustain its cyclicity due to environmetal causes after which the ‘cyclicity threshold’ is not reached anymore. (This stoppage can lead to an ‘extended low’ that is typical for cyclic populations situated in highly fractured habitats.) The cyclicity restarts if either A) the initiation threshold is reached or when B) immigrants from an actively cyclic population initiate the cyclicity.
Introduction: Population-wide Synchrony
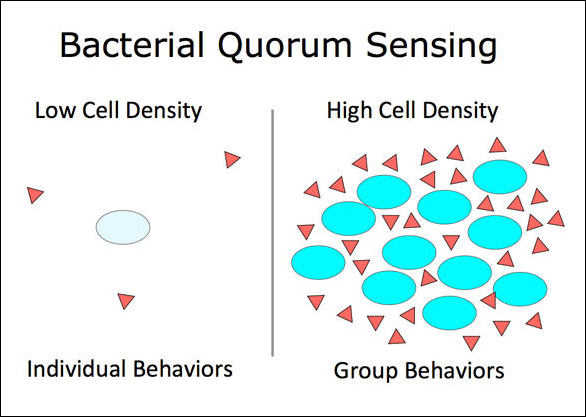
The mechanism uses chemosignals as messengers for communication inside and between populations to pursue (meta)population-wide synchrony. These chemosignals function similarly to the ‘quorum sensing molecules’ in microbiology, which allow bacteria and other micro-organisms to function as groups with shared task-priorities, e.g. migration.
Lunar and solar cycles produce repeating oscillations to related to light, geomagnetism, and gravity. Biology has adapted various methods to sense these oscillations and modulate hormone levels according to the selected oscillation. For example, virtually all animals track the daily cycle that drives the circadian rhythm.
Cyclic populations can achieve longer than daily synchrony by locking on to one of the [longer than daily] lunar or solar cycles. The table below includes examples of species with periodic multiannual population cycles that exhibit synchrony with multiannual lunar or solar cycles.
| Lunar nodal cycle 18.6y / half-cycle 9.3y | – Snowshoe hare, ruffed grouse (“These wildlife cycles have stayed closely in phase with the 9.3-year nodal half-cycle for 150 years.” Archibald, 2015) – Black grouse, capercaillie (Selås, 2019) – Autumnal moth (Archibald, 2020) – Various moths that consume deciduous woody plants (Selås & Kobro, 2022) – Barents sea shrimp, cod, herring (Yndestad, 2009: “The life cycles of shrimp, cod, herring, and haddock are related to a third harmonic of the 18.6-yr tide. … The wavelet analysis confirmed the hypothesis that a hidden deterministic process influenced the biomass ecosystem.”), and capelin. (“Barents Sea capelin has a life cycle related to a third harmonic of the 9.3-yr tide.”) |
| Spring tide cycle 3.8y | – Lemming (Archibald, 2019; Selås, 2024) |
| Solar activity cycle ~10.7y | – Porcupine (Klvana et al., 2004 “…we observed throughout our entire 1868–2000 time series a virtually constant phase relation between solar irradiance and porcupine scar data.”) – Crab (Hurt et al., 1979; Love & Westphal, 1981) – Shrimp (Driver, 1978) |
Chapter 1: Animal population cycles
- Abstract
- Introduction
- Chapter 1: Animal population cycles
- Chapter 2: Cyclic human populations
- Chapter 3: Hormones and group behavior
- Chapter 4: Further discussion
- References
1.1 Population cycles & conventional hypotheses
Many animal species undergo periodic multiannual population cycles. Typical cycles lengths include ~4 years for small rodents like lemming and vole, ~9 years for hare and moth, and ~40 years for caribou and moose. (Myers, 20181; Elton, 19242; Wang et al., 20093; Krebs, 20104; Krebs et al., 20145; Wiger, 19826; Hansson & Henttonen, 19857; Angerbjörn et al., 20098; Gunn 20039)
Below are examples of multiannual population cycles that exhibit coherent periodicity regarding the total length of each cycle. The first example is a short 35-year snippet from a +1000 years long time series: “Our report here that these regular cycles persisted without significant interruption for more than 1000 years portrays these larch budmoth cycles as even more remarkable.” (Esper et al., 200610)


Cyclic populations are common: “…we analyzed nearly 700 long (25+ years) time series of animal field populations, looking for large-scale patterns in cycles. Nearly 30% of the time series were cyclic.” “The incidence of cycles varied among taxonomic classes, being most common in fish and mammal populations. Fully 70% of the fish and mammal species comprised at least one cyclic population…” (Kendall et al., 1998/200215) A study reviewing longer (50+ years) time series of 7 bird species, 10 mammal species, and 17 insect species concluded that “In every species we found at least the likelihood of cycles.” (Witteman et al., 199016)
The venture towards a hypothesis has been intense after Elton’s 1924 review article on population cycles that made the phenomenon widely known. Environmental factors such as predators and resource availability have been suggested to drive the multiannual population cycles, but since the cycles repeat similarly no matter the environment, it is highly likely that something else is generating the cycles: “…lemmings on islands are known to be without predators and yet still undergo a 4 year population cycle.” (Ginzburg & Colyvan17, p. 79) “Numerous experiments have been done in attempts to delay the decline or stop the population cycles of lemmings and voles by feeding or excluding predators. These have had mixed results and Krebs concluded that predators can ‘modify’ population cycles, but that predator removal cannot stop cyclic dynamics. Similarly, food addition experiments can modify vole densities but not drive cycles. … Overall, experimentally stopping or starting population cycles has proven to be largely impossible.” (Myers, 20181)
Varying population density has also been suggested to be a central factor in regulating population cycles, but this too has been disproved. “In 1967, Dennis Chitty proposed that larger and more aggressive voles would be selected for in increasing and high densities, and smaller voles with delayed reproductive maturity in low densities. The ‘Chitty Hypothesis’ predicted that variable selection would lead to a genetic shift over the 3 to 4 year cycle of voles. However, the genetic shifts predicted by this hypothesis have not been observed and the levels of heritability of traits required for the shift were unrealistically high.” (Myers, 20181; Edwards et al., 202318)
Since genetic shifts do not explain the phase-dependent shifts to physiological and behavioral traits, there must be something affecting early development of animals in cyclic populations. (Sundell et al., 201919) Hypotheses that rely on epigenetic models to explain the multiannual hormone level shifts have significant shortcomings. (Juckett, 2020 [not peer reviewed]20; Levay et al., 202421) Because the multiannual hormone level oscillations repeat in a similar sequence regardless of the species, the cycle’s period, or the environment, it is evident that epigenetic models cannot comprehensively explain the source of the multiannual hormone level oscillations.
Hypotheses based on mathematical models have also failed to explain the phase-dependent oscillations, as theoretical models based on ‘density dependence’ have not been successful outside the theoretical models. “To reiterate: Our Iowa muskrats living in superior types of marshes may be said to have acted crowded when they felt crowded, whether their breeding densities were two or 10 pairs per acre, or whether their fall populations leveled off at 10 or 20 or 35 animals per acre over sizable tracts.” (The Muskrat and Population Cycles, Errington, 1963) In addition, some have raised the possibility of false detections regarding ‘density dependence effects’. (Freckleton et al., 200622)
So, after a century of intense research into animal population cycles, not even one hypothesis exists that explains even one species’ population cycles while taking into account the environmental factors not starting or stopping the cycles, leading a situation where all hypotheses are severely lacking in theory and evidence. (Andreassen et al., 202023; Oli, 201924; Myers, 20181; Lindström et al., 200125; Oli, 200326; Martínez-Padilla et al., 201327; Giraudoux et al., 201928; Brommer et al., 201029)
Since density dependency or its variations, or other previously presented hypotheses cannot explain the cycles, what can explain the recurring appearance and the phase-dependent traits of animals during the cycles regardless of the species or the environmental factors? The answer is that only a genetic mechanism that controls hormone levels can explain the animal population cycles in a coherent manner that is not dependent on environmental factors like predators, pathogens, nutrition or weather patterns.
Elton discarded the possibility of an innate biological mechanism that would generate the cycles. “This cycle of reproductive activity has been treated so far as a mysterious thing, usually attributed to some obscure “physiological rhythm.” There is nothing in physiology which offers the remotest suggestion that any such cycle (considered as an independent rhythm going on in the animals) could possibly exist.)(Elton, 19242) But after Elton’s conclusions made a century ago, the field of chronobiology has proven the existence of several controlled hormone level oscillations, such as daily / circadian, monthly / circalunar, annual / circannual, and multiannual oscillations. In addition, population-wide synchrony of biological rhythms has been documented among several species.
In fact, a population-wide hormone cycle provides a comprehensive explanation to all of the previously unanswered questions regarding periodic population cycles, such as:
- what generates the cycles;
- why do the cycles repeat with species-specific periodicities;
- why do metapopulations of the same / similar species often cycle in synchrony (or the synchrony advances as a ‘wave’); and
- why do cyclic populations from insects to mammals exhibit similar phase-dependent oscillations in the population’s average physiological and behavioral traits?
Note: The term 'hormone cycle' used throughout the hypothesis refers to the hormone secreting hypothalamic neurons being either small & inefficient or large & efficient, resulting in a multiannual oscillation in a cyclic population's average hormone levels. Therefore the term 'hormone' will be used throughout the text even though some of the molecules also work as neurotransmitters or neuromodulators in the brain. (S) Even though not all social animals have a hypothalamus nor do they share all of the same hormones, the effects to sexual functions, physical size, immune system, and migration are controlled by similar endocrinological and chronobiological mechanisms.
The endogenous multiannual mechanism creating the hormone level oscillations is connected to the olfactory system that has its independent timekeeping oscillators that are synchronized in close proximity in a population via messenger molecules. (Siehler et al., 202130; Baghel & Pati, 201531; Groot et al., 201432; Fuchikawa et al., 201633; Thomas et al., 201634; Bloch et al., 201335; Davidson & Menaker, 200336) This explains why genetically close by species – such as voles and lemmings – can cycle in synchrony if sharing a habitat: they share the chemosignaling used to initiate and syncheonize cyclicity.
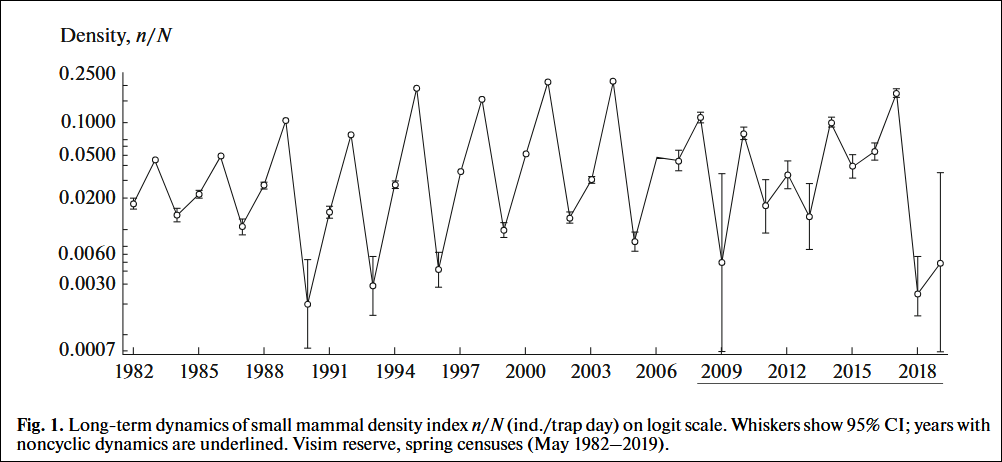
An electron microscopy study conducted on a cyclic lemming population details the multiannual oscillations in the hypothalamic hormone production, while similar finding have been made in cyclic vole populations. (Arshavskaya et al., 198937/PDF; Vladimirova et al., 200638) The image below represent the key findings from the lemming study.
To expand these findings beyond small rodents, the phenomenon of enlarged adrenal glands during / after the population peak (‘II – crucial step ‘ in above image) occurs also in cyclic hare populations: “Throughout these various investigations there is a remarkable consistency in the findings, regardless of the species… The onset of symptoms, terminating in convulsions, shows a similar pattern in every case, and all would appear to be hypoglycemic in nature.” (Christian, 195039) Abnormally high ACTH/cortisol levels can cause diabetes that leads to hypoglycemia, which indicates that cortisol levels are high during the decline phase of different cyclic animal populations regardless of the species. More examples of commonality among species are presented in the next chapter (1.2).
Several studies of cyclic animal populations have documented similar phase-related findings directly related to the endocrine system by measuring the weight and size of hormone glands, such as larger testicles during the increase phase and higher cortisol levels during the decline phase, as is the case with cyclic snowshoe hare population studies. (Sheriff et al., 201140) “Testicular development was correlated with pituitary FSH. The seasonal variation in gonadotropin of females parallels seasonal changes in litter sizes… There was a sharp decrease in pituitary FSH of females [during phase of peak population size] …which coincides with a substantial decline in reproductive rate. It is suggested that changes in pituitary gonadotropins may affect reproduction in the [cyclic] snowshoe hare population…” (Davis & Meyer, 197341)
1.2 The multiannual hormone level oscillations
This chapter presents a wide range of studies confirming the existence of the multiannually oscillating hormone levels during population cycles via direct and indirect observations. The observations are then modeled as graphic representations; first separately of each hormone, after which the hormone level oscillations are combined to form the full hormone cycle.
The sex hormone level oscillation:
Increased fecundity, gonad size and rate of sexual maturation when sex hormone (/GnRH) levels are high: phases 1 – 2.
| Species | Indicator of multiannual sex hormone oscillation | Source |
| Vole | Weight of gonads, sexual maturity | Tähkä et al., 198442 |
| Sexual maturity | Wiger, 19826; Ozgul et al., 200443 | |
| Lemming | Weight of testes, spermatogenesis, gonadotrop activity, sexual maturity | Arshavskaya et al., 198937 |
| Snowshoe hare | Pregnancy rate, ovulation rate, litter size | Cary & Keith, 197944 |
| Reproductive rate, testosterone levels | Boonstra et al., 199845 | |
| Pituitary gonadotropins | Davis & Meyer, 197341 | |
| Forest Lepidoptera, snowshoe hare, vole, lemming | Fecundity, reproductive rates | Myers, 20181 |
| Long-lived vertebrates (red deer, etc.) | Reproductive rate, age of first reproduction | Eberhardt, 200246 |
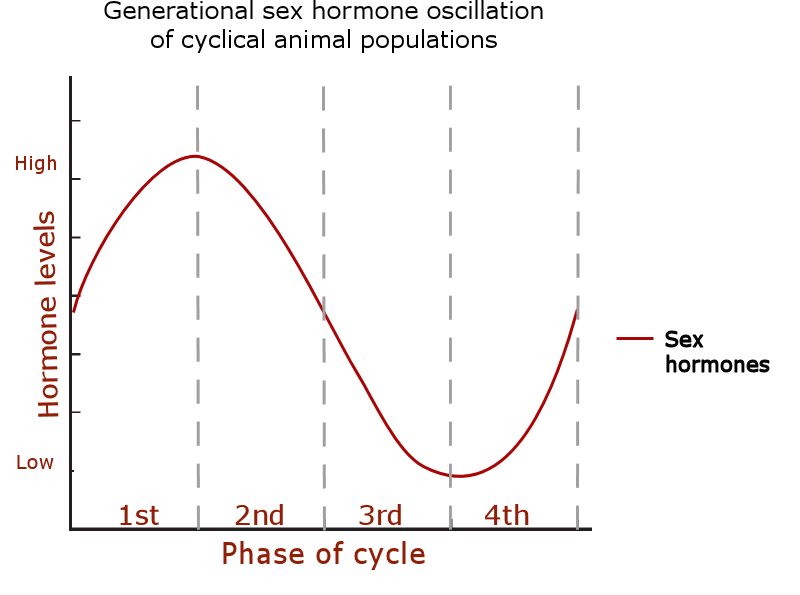
The growth hormone level oscillation:
Increased physical size and weight when growth hormone (/GHRH) levels are high: phases 2 – 3.
| Species | Indicator of multiannual growth hormone oscillation | Source |
| Vole | Weight and length | Kshnyasev & Davydova, 202114 |
| Weight | Tähkä et al., 198442 | |
| Weight and size | Wiger, 19826; Lambin et al., 200647; Olea et al., 202448 | |
| Weight | Cheprakov, 201149 | |
| Vole and lemming | Weight | Oli, 199950 |
| Lemming | Weight | Fauteux et al., 201551 |
| Peromyscus | Size | Wolff, 199352 |
| Shrew | Weight | Yakushow & Sheftel, 202053 |
| Snowshoe hare | Size (fem) | Boonstra et al., 199845 |
| Weight | Majchrzak et al., 202254 | |
| Forest Lepidoptera | Smaller body size, larger wings during mid-cycle (fem) | Rhainds, 201955 |
| Red deer | Birth weight | Albon et al., 198756 |
If a cyclical population stops being cyclic, the size and weight of the animals stops oscillating as well. (Olea et al., 202448)
It is important to note here that there are exceptions to the main rule of physical size peaking close to mid-cycle, aka. “the Chitty effect” that states that the average size of animals is largest during mid-cycle in most of the species. (Oli, 199950) For example, forest Lepidoptera of cyclical populations have been observed to have a smaller body size but larger wings towards mid-cycle. (Klemola et al., 200857; Klemola et al., 200458) In some species, the body size has not been observed to vary virtually at all during a population cycle, making the growth hormone oscillation the least common among different species’ population cycles.
The cortisol level oscillation:
Increased stress symptoms and immune response when cortisol (/CRH) levels are high, resulting in increased incidence of diabetes: phases 3 – 4. It should be noted that cortisol measurements vary the most between studies, but this is to be expected, since cortisol levels can be measured utilizing various methods, all of which can produce different results.
| Species | Indicator of multiannual cortisol oscillation | Source |
| Vole | Adrenal weight, adrenocortical function, inflammation | Geller & Christian, 198259 |
| Lemming | Signs of hypercorticism in the adrenal cortex | Arshavskaya et al., 198937 |
| Vole & lemming | Abnormal blood glucose, diabetes | Niklasson et al., 200660 |
| Snowshoe hare | Cortisol levels | Boonstra et al., 199845 |
| Snowshoe hare & other mammals | Adrenal cortical hypertrophy and hypoglycemia | Christian, 195039 |
| Forest Lepidoptera | Survival rates | Myers, 20181 |
| Sika deer | Adrenal weight | Christian et al., 196061 |
| Long-lived vertebrates (red deer, etc.) | Increased mortality rates | Eberhardt, 200246 |
The dopamine level oscillation:
High dopamine levels increase feelings of social dominance (Yamaguchi et al., 201762; Nader et al., 201263; Ghosal et al., 201964; Dwortz et al., 202265) and fearful behavior: phases 4-1. (Pignatelli et al., 201766; Wenzel et al., 201867; Salinas-Hernández & Duvarci68)
Dopamine is involved in regulating movement and influences behaviors related to migration, such as exploration and locomotion. Animal studies have shown that variations in dopamine affect movement patterns and motivation, which could indirectly influence migratory behavior. Dopamine levels can modulate home ranges and migration (Marzecova et al., 202169; Matthews et al., 201670; Mahabir et al., 201371), and aggressive behavior: phases 2 – 3.
| Species | Indicator of multiannual dopamine oscillation | Source |
| Lemming | Dopaminergic activity | Arshavskaya et al., 198937/PDF |
| Vole, lemming, snowshoe hare, Lepidoptera | Migration | Myers, 20181 |
| Vole, red grouse | Aggression (Note: the orientation of aggression is also phase-dependent.) | Myers, 20181 |
The complete multiannual hormone cycle:
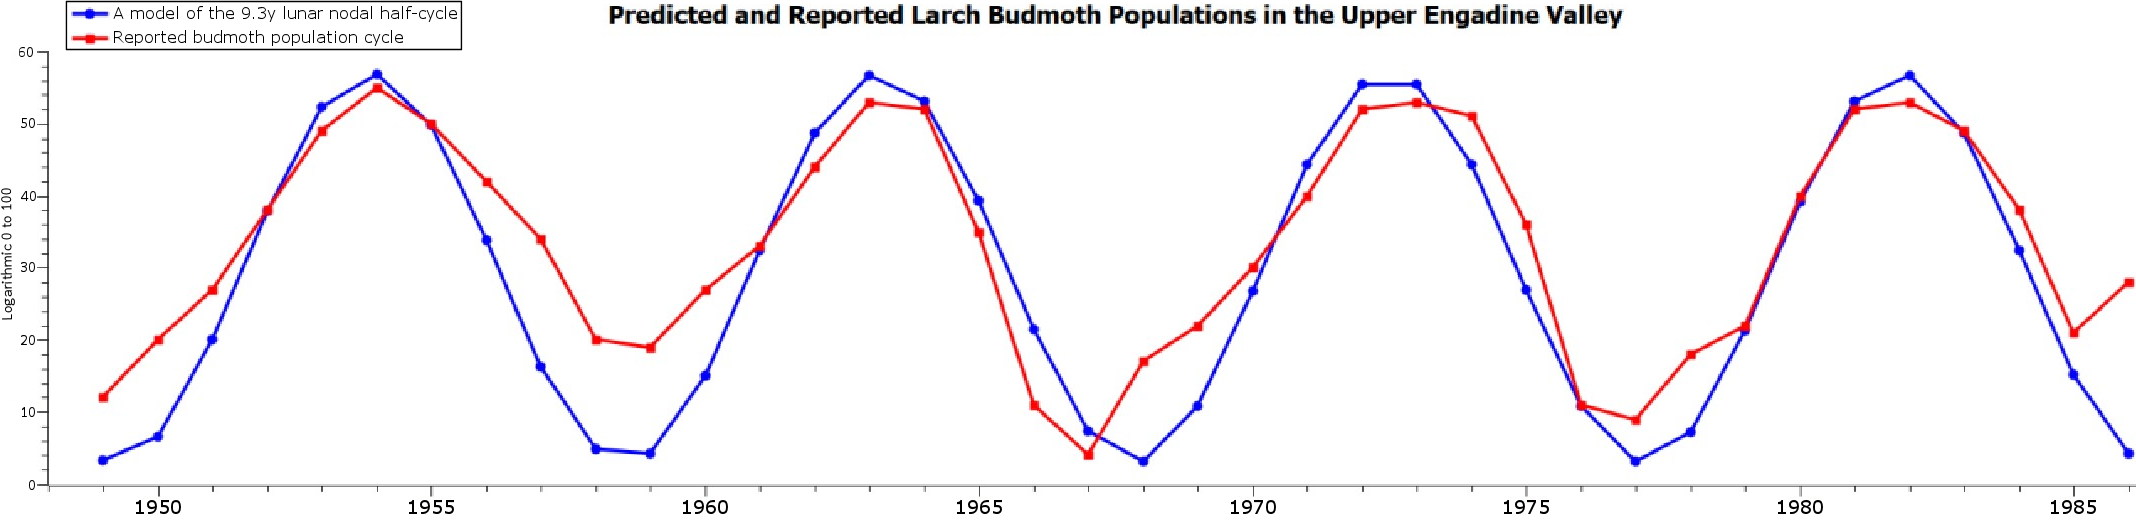
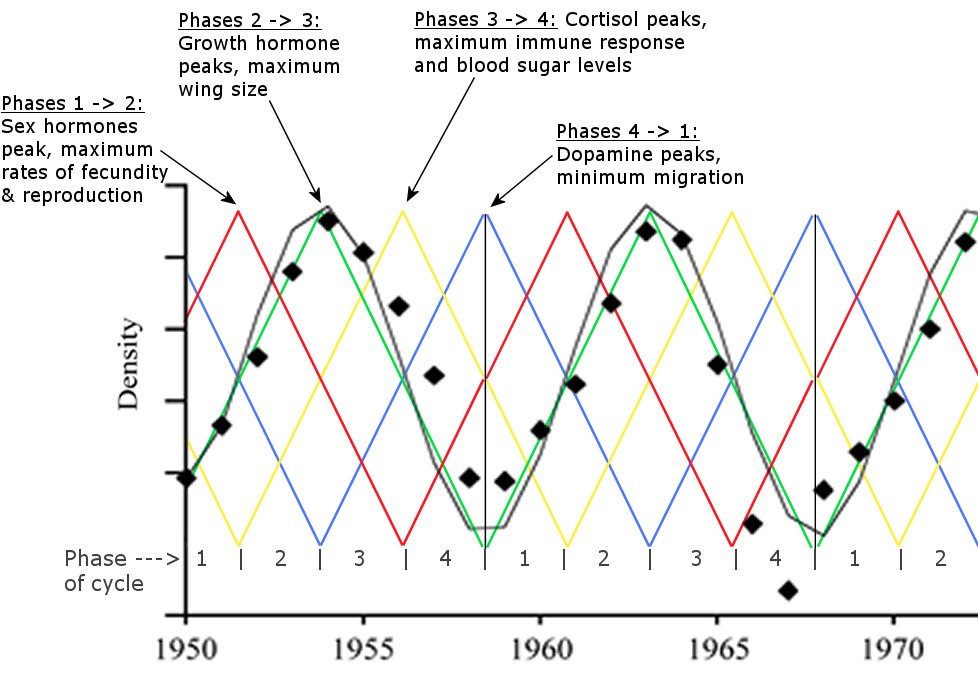
To visually present how the multiannual hormone level oscillations generate the periodic animal population cycles, the hormone cycle (above) is merged with a larch budmoth population cycle (below).
Another example is provided below by inserting the generational hormone cycle into a snowshoe hare population cycle spanning over three decades, and while the match isn’t 100% throughout the decades, as the hare cycle becomes slightly shorter in the mid 90s, slightly reducing the periodicity of the oscillations would accommodate the variance.
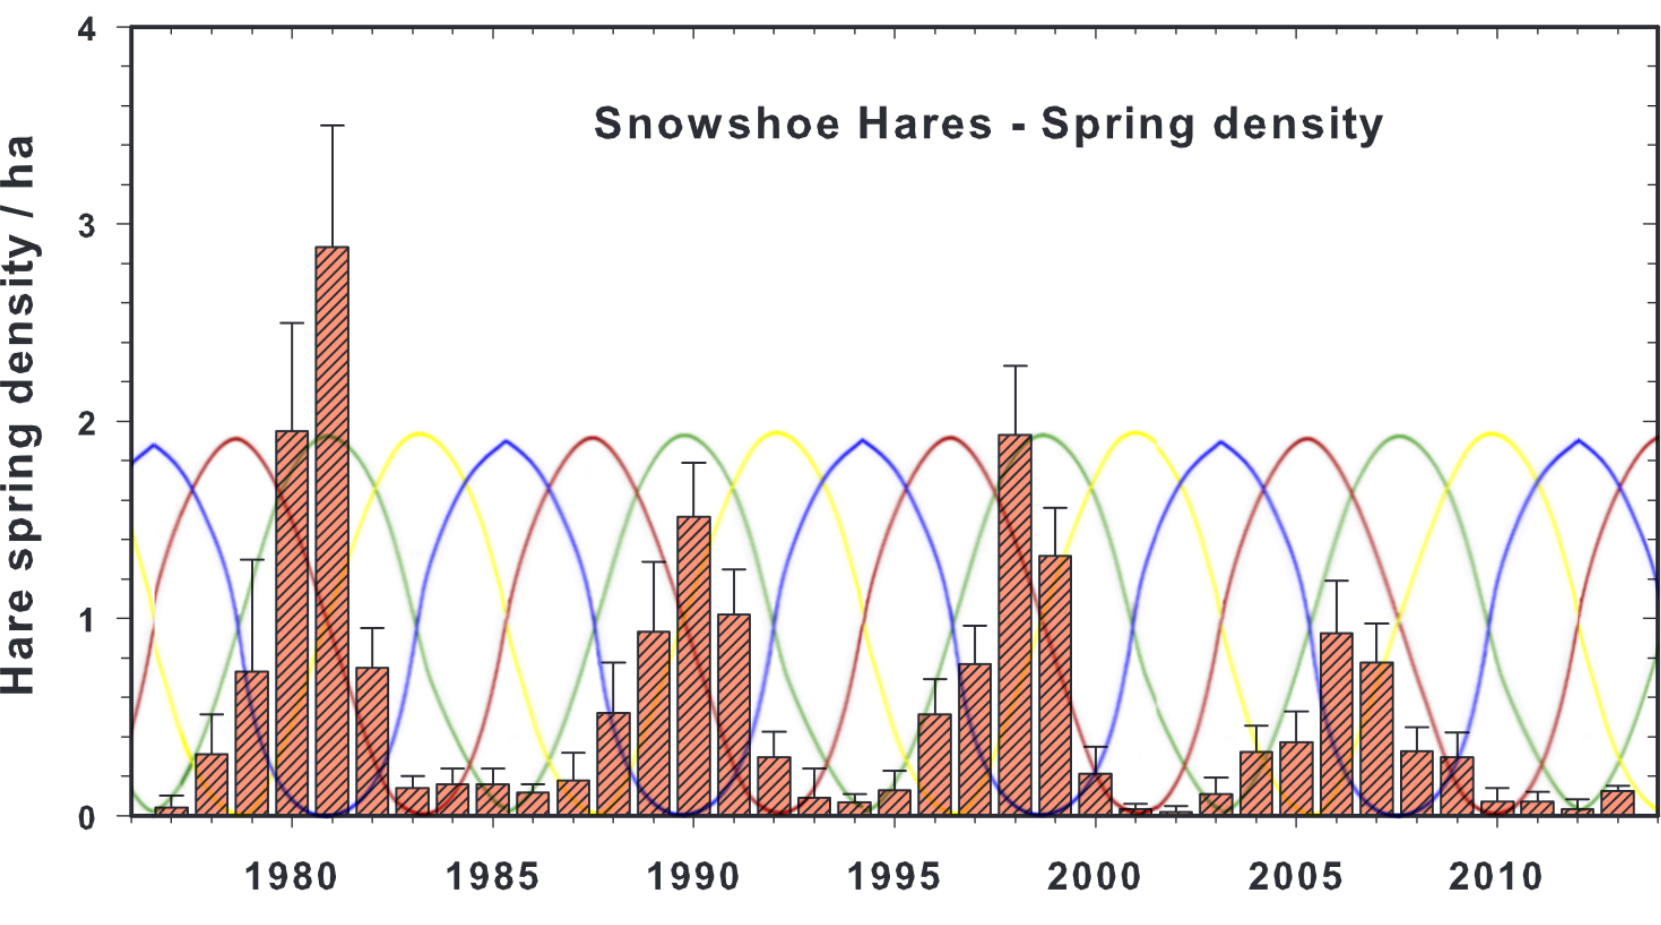
Red oscillation is for sex hormones, green oscillation for growth hormone, yellow oscillation for cortisol, and blue oscillation for dopamine. The model’s cycles do not perfectly fit the oscillating population densities later in the cycle, as the cycle shortens by roughly one year during the 1990s, but the correlations are still very close from the 1970s to the 2010s.
While fish species undergo population cycles, these are not yet accounted for in this hypothesis, but will be included in future updates. (Marjomäki et al., 202173) Biannual cycles essentially compress the oscillations into two years: sex hormones and growth hormone peak during the first year, after which cortisol and dopamine peak during the second year.
1.3 The cyclical metapopulation mechanism
1.3.1 The automated resource management & colonization process
The cyclical metapopulation mechanism provides automatic resource management & colonization processes for cyclic populations. The multiannual hormone level oscillations are the implementation phase of these processes as depicted below. The process begins once the cyclicity threshold is reached. Although the treshold’s exact requirements are not yet known, cyclicity initiates once 1) a certain number of animals are in 2) a certain developmental phase, and 3) density is high enough for the chemosignals to mix. It has been observed that, on average, densely populated habitats initiate and continue cyclicity more frequently than loosely populated or fragmented habitats. (Moss et al., 201074)
Phase 1: Maximum rates of reproduction (max. sex h.) and survivability (min. cortisol) result in a rapid population expansion.
Phase 2: Population size peaks while physiological and behavioral traits are optimized for emigration and seizing habitats, i.e. max. physical size and mass (max. growth h.) with the exception of avian species having smaller body size but larger wings for increased migration range, and increased tendency for aggression and low levels of fearfulness (min. dopamine). Migration activity peaks as animals emigrate outwards to colonize and expand the metapopulation.
A) If encountering empty habitats -> form new colonies in order to increase the size, reach and density of the metapopulation.
B) If encountering colonies of genetically similar species -> increases the metapopulation’s gene flow, decreases the likelihood of inbreeding, and initiates/synchronizes the multiannual cycle in the colony. (Bjørnstad et al., 200875)
C) If encountering colonies of genetically incompatible species -> the migrants can try to seize the habitat or move on.
Female fecundity has been observed to become suppressed during mid-cycle, which also serves the purpose of emigration, since energy is reserved for the emigration to succeed and the females’ reproductive rate is increased once they have dispersed into new uninhabited ares. (Clarke, 197776)
Phase 3: Minimum rates of reproduction (min. sex h.) and low survivability (max. cortisol) cause the population count to crash, which allows the primary food source to replenish in order to support the next cycle’s rapid population increase. “Based on a review of the literature, we suggest that period length in animals showing multiannual cycles is related to the life span of their food plant rather than to any trait of the animal, such as mass or fecundity. A path analysis, on the vertebrate herbivores, shows that 92% of the variation in cycle length is explained by food-plant longevity and that body mass adds little to this.” (Högstedt et al., 200577; Zamin & Grougan, 201378) The crash in population count typically causes the predator populations to decrease in size and possibly migrate in search of nutrition. (Arnold et al., 202479; Wiger, 1982) Slower sexual maturation results in a longer developmental periods that increases adaptation. This can be especially beneficial for those migrants’ offspring that are situated in novel environments.
Phase 4: Physical size is small (min. growth h.) to allow the primary food source to continue recovering, while the rate of reproduction and survivability begin to increase. Suboptimal habitats are abandoned in favor of optimal habitats (max. dopamine), which supports the continuity of cyclicity in the optimal habitats. High level of fearfulness (max. dopamine) and small physical size increase predator avoidance, limiting the recovery of the predator populations. Dopamine increases physiological and behavioral sensitivity, which results in increased epigenetic adaptation. (Nagy & Turecki, 201280)
1.3.2 Cycle periods & synchrony
Periodic population cycles are known to have species-specific period ranges and synchronies periods are known the vary within and between species with cyclic populations. Although the exact that define the periods are not yet known [as of Aug 2025], below is an overview of the proposed timekeeping machinery.
Cyclic populations are known to be able to achieve spatial synchrony of cyclicity across large geographical areas, i.e. synchrony of the cycles’ phase among cyclic populations. While the exact cause of this phenomenon has been previously unknown, it has been linked to the periodic dispersal / migration phase of cyclic populations. (Moss et al., 201074; Abbott, 201181) The range and type of synchrony varies by species. It is common for the synchrony to advance as a wave among habitats after a certain distance from a cyclic population’s centerpoint has been reached. (Liebhold et al., 200482)
In light of these observations, it is plausible that the mechanism uses chemosignals as messengers to communication within and between populations to A) initiate cyclicity and determine cyle period, and also to B) pursue and maintain synchrony. These chemosignals therefore function similar to the ‘quorum sensing molecules’ in microbiology, which allow bacteria and other micro-organisms to function as organized groups and perform timed task-priorities, such as migration.
Lunar and solar cycles produce repeating oscillations of light, geomagnetism, and gravity. Biology has adapted various methods to sense these oscillations and modulate hormone levels accordingly, but it should be noted that the exact transformation process is still an unknown to science.
For example, circamonthly biological rhythms – that directly modulate hypothalamic hormone levels – are known to synchronize with lunar cycles. (Andreatta & Tessmar-Raible, 202083; Kaiser & Neumann, 202184; Helfrich-Förster et al., 202185) Especially many reproductive cycles are known to synchronize with lunar cycles. (Skov et al., 200586)
In order to achieve multiannual synchrony, cyclic populations would need to track multiannual lunar cycles via moonlight and/or gravimetric cycles of the Moon, or solar oscillations, possibly via electromagnetism. (Haigh et al., 201187; Peng at al., 201988; Bevington, 201589) The table below includes population cycle periods that exhibit synchrony with multiannual lunar and/or solar cycles.
| Lunar / solar cycle | Species |
| Lunar nodal cycle 18.6y, half-cycle 9.3y | Snowshoe hare (Archibald, 201590) |
| Ruffed grouse (Archibald, 201590), capercaillie and black grouse (Selås, 201991) | |
| Autumnal moth (Archibald 202092, 93), moths feeding on deciduous woody plants (Selås & Kobro, 202294) | |
| Barents sea capelin, shrimp, cod and herring (Yndestad, 200995) | |
| Spring tide cycle 3.8y | Lemming (Archibald, 201996, Selås, 202497) |
| Solar activity / sunspot cycle ~10.7y | Crab (Hurt et al., 197998, additional time series: Higgins et al., 199799) |
| Porcupine (Klvana et al., 2004100 and the preceding thesis Klvana, 2002) |
The solar cycle has a variable periodicity: ~10.7y for the past century, and 10.1y, 10.8y, and 11.6y being the most common cycle lengths during the past two centuries. (Bhattacharyya & Narasimha101)
The table below includes multiannual cycles that are possible timekeeping signals / zeitgebers.
Multiplier | 3.8y Spring Tide Cycle | 8.85y Lunar Anomalistic Cycle | 18y Saros Cycle (inc. 3.01y and 6.01y) | 18.61y Lunar Nodal Cycle |
| 0.5 | 1.9 | 4.4 | 9.0 | 9.3 |
| 1x | 3.8y (3.796) | 8.85y (8.8475) | 18.03y | 18.61y (18.6128) |
| 1.5 | 5.7 | 13.3 | 27.0 | 27.9 |
| 2 | 7.6 | 17.7 | 36.1 | 37.2 |
| 2.5 | 9.5 | 22.1 | 45.1 | 46.5 |
| 3 | 11.4 | 26.6 | 54.1 | 55.8 |
| 3.5 | 13.3 | 31.0 | 63.1 | 65.1 |
| 4 | 15.2 | 35.4 | 72.1 | 74.4 |
| 4.5 | 17.1 | 39.8 | 81.1 | 83.7 |
| 5 | 19.0 | 44.3 | 91.2 | 93.1 |
The multiannual mechanism’s similarity across different species and coupling with lunar / solar cycles of different lengths can be compared to migratory birds’ coupling with the annual light cycle: bird populations exhibit migratory behavior depending on the phase of the year, yet their full annual migratory program can be compressed to a time span of just two months by experimentally shortening the annual light cycle. (Gwinner, 1998102) The birds’ new entrained circannual cycle (of 6 months) can persist up to 12y when moved to a neutral (i.e. seasonless) environment that has a 12/12 light cycle.
1.4 Evolutionary functions & advantages
1.4.1 Hormone levels and development
The mechanism fundamentally affects the average developmental path when the cycle is active. The endocrine system modulates the development of animals via hormone levels – beginning from the embryonic stages of an organism – by affecting gene expression, including the expression of HOX genes. (Daftary & Taylor, 2006103; Lutchmaya et al., 2004104)
While genetic and epigenetic information define an animal’s basic structure, functions and traits, the hormone system actively modulates the physiological & behavioral states of animals, thus also affecting developmental paths of animals. Therefore, both of the statements below are correct.
A cyclic population’s average physiological and behavioral states oscillate constantly.
The multiannual hormone level oscillations result in cohort-specific developmental paths.
Even though different species have different developmental paths, the effects are universal: the phase of the cycle directly affects each generation’s average physiological and behavioral traits. For example, the development of gonads and is faster during phases 1 and 2 when the sex hormone oscillation is at its highest point.
[Visual examples of developmental paths will be added later on.]
Due to succeeding cohorts undergoing different developmental paths, the cyclical metapopulation mechanism catalyzes both microevolutionary and macroevolutionary processes in comparison to non-cyclic populations. In comparison, non-cyclic populations exhibit less variation to average traits between generations, while cyclic populations produce larger numbers of physiological and behavioral extremes available for natural selection, which leads to an increased rate of adaptation. (Engen et al., 2020105)
Quoted below are Elton’s conclusions in his seminal 1924 article on the evolutionary processes the periodic multiannual animal population cycles seem to exhibit.
7. The effects of these periodic fluctuations on evolution must be very great, although at present problematical; but the following
suggestions are made:(a) Natural selection of some character[istic]s must be periodic.
(b) There will be different types of natural selection at the maxima and minima of numbers.
(c) The struggle for existence, and therefore natural selection, tend to cease temporarily during the rapid expansion in numbers from a minimum, and new mutations have then a chance to get established and spread, i.e. without the aid of natural selection. This might happen only rarely.
(d) This would explain the origin and survival of non adaptive characters in a species.
(e) On the other hand periodic reduction in numbers will act as an important factor causing uniformity in the species.
(f) The opposing factors (c) and (e) will vary much in different species, and the problem will require the combined attentions of mathematicians, and of ecologists working on the methods of regulation of the numbers of animals.
(g) This mechanical uniformity factor, since it acts independently of natural selection, explains how a particular structure or habit may evolve, when it only has a general adaptive significance.
Elton, 19242
Compared to non-cyclic populations, periodic population cycles counteract all of the Hardy-Weinberg Equilibrium’s key points that cause stale evolution: 1) no mutations, 2) mating is random, 3) natural selection is not a factor, 4) population size is large, and 5) there is no gene flow, the equilibrium causes a population’s allele and genotype frequencies to stay constant.
1) More mutations due to the phase of large population size.
2) Multiannual changes to mating behavior sex hormones.
3) Catalyzed natural selection due to oscillating min/max average traits and increased rates of emigration & immigration.
4) Multiannually varying population sizes.
5) increased migration between populations in a metapopulation, thus increasing gene flow between populations, the cycle essentially accelerates evolution by removing the elements described in the Hardy-Weinberg Equilibrium that de-accelerate evolution.
Furthermore, the Red Queen hypothesis states that a population that does not evolve faces defeat against a population that evolves. (Brochurst et al., 2014106; Strotz et al., 2018107) Therefore, it is rather obvious that the cyclical metapopulation mechanism provides substantial advantages for cyclical [meta]populations.
1.4.2 Periodic migration and gene flow
Periodic animal population cycles produce periodic range boundary pulses. (Walter et al., 2015108) During the mid-cycle migration phase, an increased percentage of animals emigrate and colonize new habitats and areas, i.e. the migration phase increases the density and geographic size of a cyclic population at regular intervals, thus increasing the rate of gene flow between conspecific populations inside a metapopulation. (Franklin et al., 2014109)
Furthermore, gene flow increases during the migration phase. “During the peaks, the accumulation of new alleles (i.e., alleles not discovered before within the population) and the appearance of a homogenous population structure suggest higher migration rates and, consequently, increased gene flow within the population compared to the crash periods.” (Rikalainen et al., 2012110) Another study based on data from seven cyclic lemming population states: “High genetic variability thus implies high gene flow over a considerable area for lemmings… Examination of empirical data suggests that high genetic diversity may be the rule rather than the exception in cyclic populations.” (Ehrich & Jorde, 2005111)
Cyclic populations and the periodic dispersal they exhibit have been found to be central to the persistence of metapopulations. “Our analysis was couched both in terms of coarse and fine-scale network features. With regard to the former, at least for random systems, connectivity and heterogeneity in connectivity were found to be two key factors that enhance metapopulation persistence. In terms of more fine-scale features, the existence of critical dispersal routes have been identified, while cycles have been shown to play a prominent functional role, allowing metapopulations to bootstrap themselves into persistence.” (Yael Artzy-Randrup & Stone, 2010112) “It is also shown that dispersal has a stabilizing impact on heterogeneous metapopulations that correlates positively with the number of patches and the connectance of metapopulation networks.” (Tromeur et al., 2017113)
The migration phase has been documented to cause significant evolutionary effects – possibly more significant than the other microevolutionary processes of cyclic populations: “In their review of population cycles, Norén and Angerbjörn (2014) concluded that the signatures of genetic drift and selection on population genetic diversity are weaker and obscured by density-dependent dispersal. The present study adds to the growing body of evidence that dispersal usually overshadows the impact of other microevolutionary processes in cyclic populations.” (Ishibashi & Takahashi, 2021114; Lidicker, 2015115; Norén & Angerbjörn, 2014116)
The gene flow effect in a metapopulation is enhanced by the fact that the cycles are often in sync between nearby cyclic populations. (Krebs et al., 2017117) (Tähkä et al., Endocrine aspects of population regulation in the genus Clethrionymus, Mem. Soc. fauna Flora Fenn., 1984) The cycles can alternatively advance as a wave in terrain, resulting in an increased rate of gene flow mainly between populations that are located on the same wavelength: “Then, the observed higher scale of gene flow in the direction parallel to the wave front may result from the recurrent redistribution of the genetic diversity during each outbreak between populations fluctuating in synchrony.” (Berthier et al., 2013118; Sherratt & Smith, 2008119; Jepsen et al. 2016120; Krebs et al., 2017)
Having a simultaneous migration phase increases the rate of gene flow between populations, since during the migration phase both immigration and emigration are more likely to occur at increased rates. If populations do not cycle in synchrony, cyclic populations not undergoing the migration phase wouldn’t be as receptive regarding the immigrants, nor would they send emigrants into nearby populations in migration phase and accepting immigrants. Cycle synchrony typically decreases when the range between the populations increases. (Walter et al., 2017121)
A partially isolated population can increase a metapopulation’s overall stability. “Metapopulation dynamics, which involves partially isolated patches yielding overall stability to a system, is a rich resource for biologists aiming to arrest the current catastrophic loss of biodiversity.” (Gibbs & McCullough, 1997122)
As a general example of cyclicity increasing the rate of evolution, voles are known to undergo periodic population cycles with high amplitude oscillations regarding populations counts, which may be the reason for their high rate of evolution: “The study focuses on 60 species within the vole genus Microtus, which has evolved in the last 500,000 to 2 million years. This means voles are evolving 60-100 times faster than the average vertebrate in terms of creating different species.” (Fletcher et al., 2019123/S) Dampening of the cycles has been shown to reduce genetic diversity of small mammal populations. (Ecke et al., 2017124)
The mid-cycle high population count phase of cyclic populations can also theoretically accelerate evolution through higher rates of beneficial mutations when compared to a non-cyclic population with less variance to population size, since larger populations are more likely to find beneficial mutations, although, this presumption would need to be validated experimentally to be certain of it. (Vahdati et al., 2017125)
1.4.3 Predator avoidance
Predator avoidance can be more efficient in a cyclic population compared to a non-cyclic population, since a cyclic population’s average physical and behavioral attributes change annually, resulting in a situation where the predators are always lagging in microevolution as they try to adapt to the changing traits of the prey. A non-cyclic prey population has less year-to-year variance to average traits, making it easier for the predators to adapt to the prey population’s average physiological and behavioral traits.
The annually oscillating average physical size of a cyclic population is a good example: if a prey population’s each birth cohort’s average size is always different from the previous cohort, it becomes more difficult for the predator to catch the prey, since body size plays a crucial role in predator-prey interactions. (Lundvall et al., 1999126) During a population cycle, the predator’s jaws and other physical properties cannot adapt to the changing of their prey animal’s size in time, (unless the predator species would have a much shorter lifespan, so it could quickly adjust to the changes), resulting in the predator population lagging the prey population in adaptation. However, if the predator lives as long or longer than what the average population cycle length is for the prey population, the predator can adapt to the size variance of an entire cycle’s length.
Other examples that directly affect predator avoidance: dopamine levels affect how far away the prey forage from their habitat and how fearful the animals are, and sex hormone levels affect the ratio of young vs. adult animals in the prey population. [The evolutionary benefits of the cyclical metapopulation mechanism will be expanded in updates.]
1.5 Bacterial population cycles: same mechanism?
This hypothesis also poses a fundamental question regarding the evolutionary origins of the cyclical metapopulation mechanism: are bacterial population cycles also driven by a ‘metapopulation mechanism’? The question arises from the fact that – similar to animal population cycles – the origins or bacterial population cycles too have been attributed to random environmental interactions. (Nguyen et al., 2020127; Himeoka & Mitarai, 2020128) Yet recently published articles suggest that bacterial cycles may not be formed via random interactions afterall.
There are clear similarities between the periodic population cycles of animals and bacteria, such as A) species-specific ranges of cycle periodicities, B) four cycle phases of preprogrammed physiological and behavioral traits, and C) similar phase-dependent group activities, such as the mid-cycle migration phase.
As for the benefits of periodic bacterial population cycles, the quote below encapsulates the importance of periodic migration for bacterial populations and how the migration synchronizes the cycles.
In general, disconnected networks or fragmented habitats are considered undesirable because isolated populations are susceptible to extinction due to demographic stochasticity or environmental fluctuations. In the presence of migration, individuals from neighboring populations can stabilize an endangered population. In addition, migration can counteract stochastic extinction of a local population by creating a metacommunity with a larger total population size. Furthermore, migrants can repopulate nearby patches that have gone extinct. The concept that migration can prevent permanent population collapse has led to the construction of conservation corridors that are intended to prevent local extinctions by facilitating movement between previously unconnected habitat patches.
However, excessive migration can lead to synchronization of population dynamics in connected habitat patches. In harsh environmental conditions, synchronization can enhance the risk of global stochastic extinction during periods of collective decrease in population size, since patches effectively merge into one large population in the limit of strong coupling.
Gokhale et al., 2018129
Bacterial population cycles provide a possible explanation to how animal populations utilize messenger molecules to initiate cyclicity, as bacterial populations use chemical messengers to communicate and, when density is high enough, act as a group. This system is called ‘quorum sensing’.
Animals are suggested to be using a similar molecular messenger system to detect nearby individuals and initiate cyclicity when requirements are met. After initiation, animal group behavior is modulated via the oscillating hormone levels.
There is one significant distinction between bacteria and the evolutionarily older archaea that points to quorum sensing being a part of the system that initiates periodic bacterial population cycles.
A) Archaea have a less advanced quorum sensing system and do not undergo periodic population cycles.
B) Bacteria have a more advanced quorum sensing system and do undergo population cycles.
Furthermore, the quorum sensing mechanism includes two paraller channels, one channel for intra-species communication, one channel for all other bacterial species. Both channels modulate group behavior via group behavior genes.
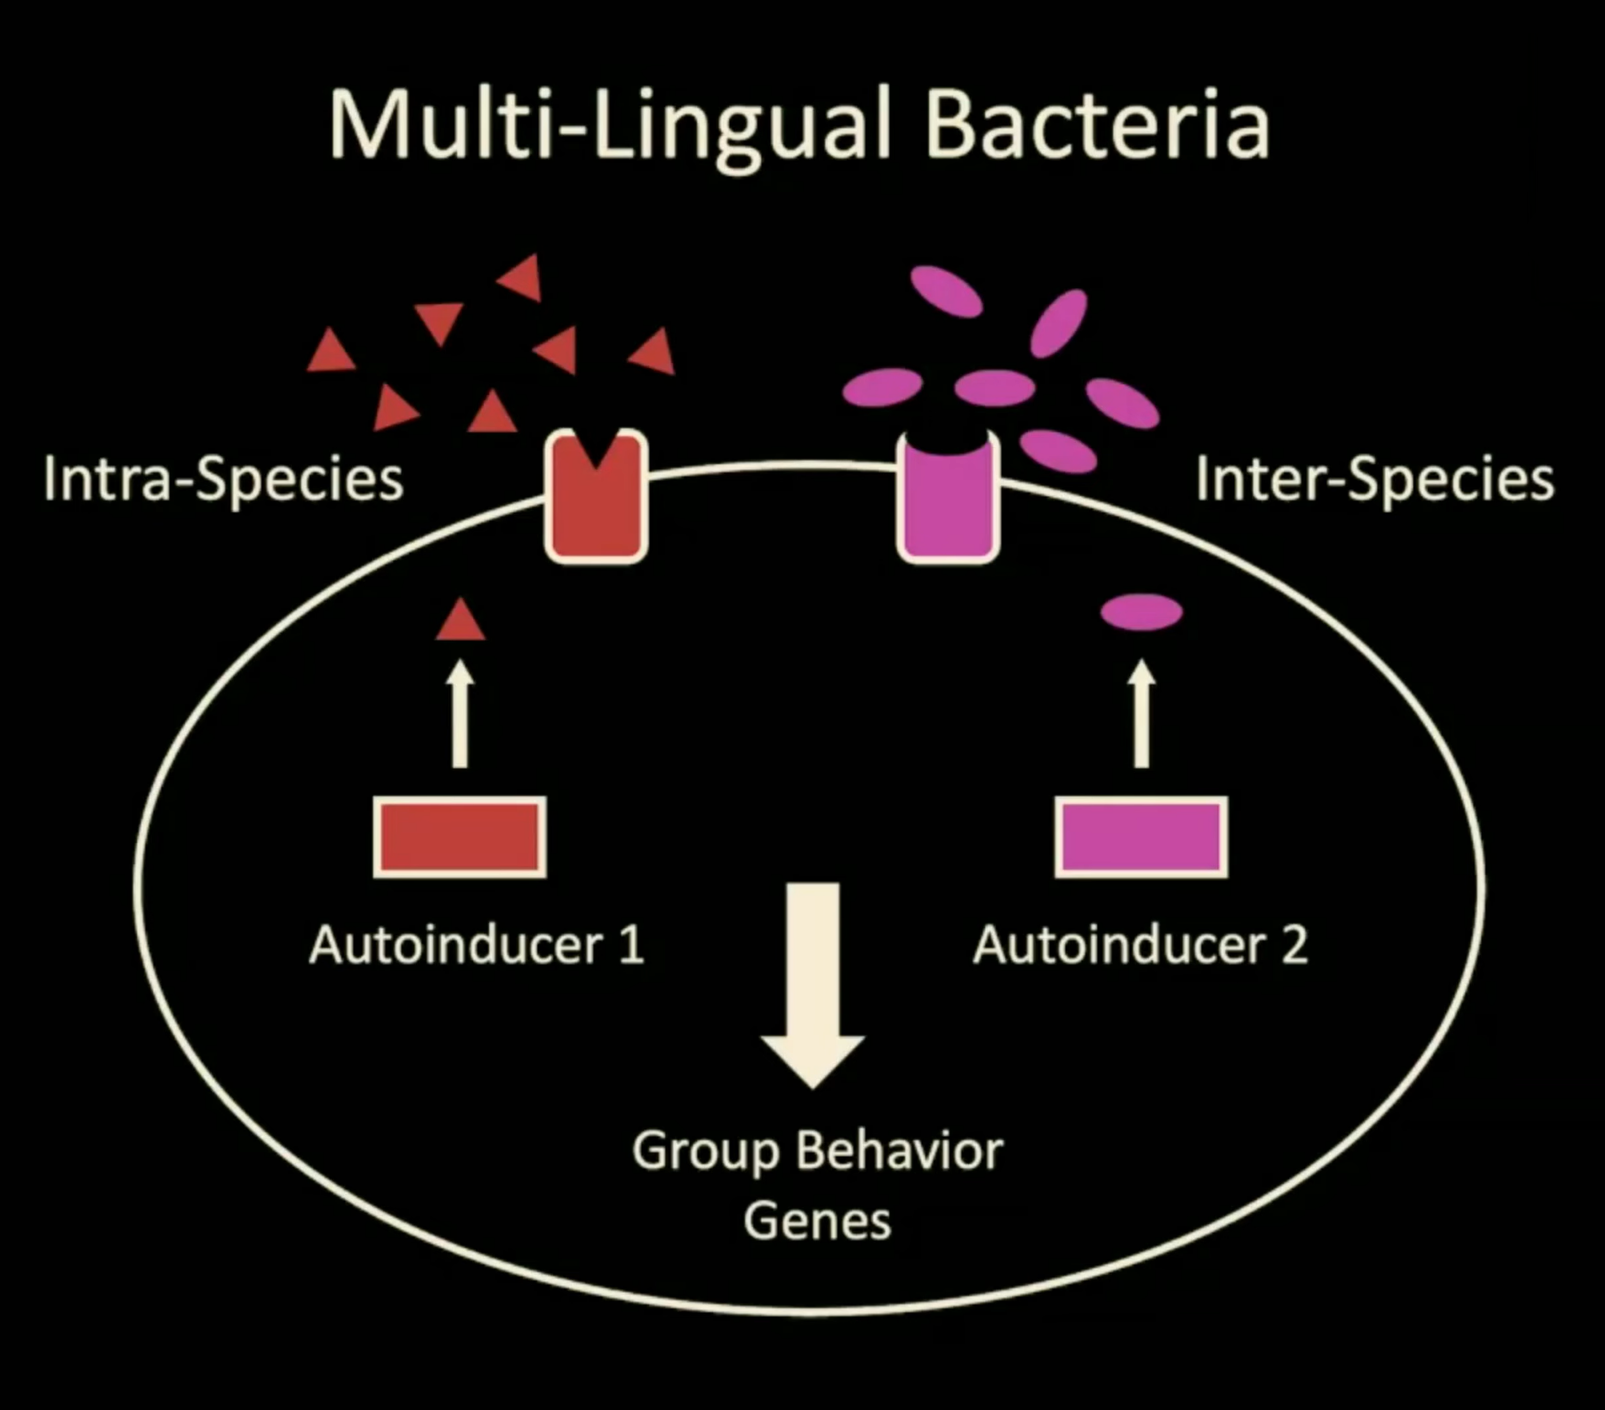
If animals use a similar system as quorum sensing to initiate cyclicity, how many channels does it have? The current [May 2026] proposal is stated below.
1) The intra-species messenger molecule is used for communicating within a single species.
2) The inter-species messenger molecule is responsible for sensing other species within the taxa.
This would mean that only interspecies individuals can initiate cyclicity, while the inter-species messenger molecule can initiate and synchronize cyclicity of evolutionarily closeby species, i.e. within a certain taxa. Even though it is currently unknown what the limits of either the intra-species or the inter-species messenger molecules could be, further listing of species cycling together and comparing their taxa should provide an explanation to this currently open question.
1.6 Human activity disrupting cyclicity
After highlighting the various significant benefits that population cycles provide for metapopulations, it is clear that human activities disrupting these cycles cause damage to entire metapopulations. One example of such disruption is human infrastructure that blocks migratory routes. It is important to emphasize that human activity has disrupted the flow of these natural metapopulation processes (aka. population cycles), which has led to severe losses in biodiversity and enabled non-native species to invade new habitats.
Some of these losses can be fixed and further damages avoided if the remaining animal populations are allowed to cycle without interruptions. Proactive measures – e.g. building wildlife crossings and limiting hunting that disrupts population cycles – are crucial steps on the path of restoring the natural state of damaged ecosystems. Disruptions to the natural flow of population cycles hampers the ability of metapopulations to adapt to the changes in their environment, such as higher temperatures caused by rapid climate change or lower temperatures caused by a volcanic eruption, or the arrival of invasive or predator species.
In addition to ensuring that the migratory routes are restored, it is important to note that light pollution hampers the ability to sense moonlight and leads to desynchronized biological rhythms that regulate hormone cycles. [Cit. to be added) Electromagnetic pollution can also disrupt biological rhythms and alter hormone levels. (Martel et al., 2023130; Bandara & Carpenter, 2018131) The most efficient measures to promote cyclicity will be apparent once the inner workings of the cyclical metapopulation mechanism are fully uncovered.
As a summary of chapter 1, below is a comparison between this hypothesis and other hypotheses that aim to explain what generates the multiannual animal population cycles.
Typical characteristics of cyclic populations | Do hypotheses relying on environmental and/or innate factors fully explain the characteristics? | Does a multiannual hormone cycle fully explain the characteristics? |
| Phase-dependently increasing/decreasing fecundity, litter size, and sex hormone levels | No. Attempts to initiate or stop cyclicily have been unsuccessful. | Sex hormone oscillation. |
| Phase-dependently varying physical size | No. The ‘Chitty hypothesis’ of epigenetics causing growth hormone levels to oscillate have been debunked. | Growth hormone oscillation. |
| Phase-dependently increasing/decreasing levels of cortisol and stress related behavior | No | Cortisol oscillation. |
| Phase-dependently increasing/decreasing rates of migration and aggression | No | Dopamine and growth hormone oscillations. |
| Synchronous cycles over vast geographical areas | No | Synchrony achieved via chemosignals. Migration promotes metapopulation synchrony. |
| Explanation for cycle lengths | No (replenishment rate of primary food source is the best indicator) | Cycle length is presumably determined by the lunar cycle used as a zeitgeber. |
| Cycles initiate and persist largely regardless of theenvironmental factors, even if experimentally controlled | No | Via a persistent endogenous hormone cycle (cyclicity may stop in adverse conditions) |
| Genetically similar species in the same area often cycle in synchrony (e.g. vole and lemming) | No | Similar chemical messengers among genetically similar species |
Chapter 2: Cyclic human populations
- Abstract
- Introduction
- Chapter 1: Animal population cycles
- Chapter 2: Cyclic human populations
- Chapter 3: Hormones and group behavior
- Chapter 4: Further discussion
- References
2.1 Generational hormone theory
2.1.1 Introduction
After establishing in chapter 1 a population-wide hormone cycle generates the periodic population cycles of all species, chapter 2 presents the possibility of the same hormone cycle being active among human populations. After all, it is more probable than not, as an estimated 70% of mammalian species undergo periodic population cycles.
This chapter includes a wide range of statistics directly indicating that the population-wide hormone cycle is currently active among the Western countries. [Note: this introduction doesn’t include sources, but all sources are found in the respective subchapters.] In addition, these statistics have been in geographic synchrony after the 1940s: the US population is the first/primary pulse after which Canada, Australia, and most European countries follow with an average lag of 0-5 years. The lag grows towards the East and is ~10 years in Eurasia.
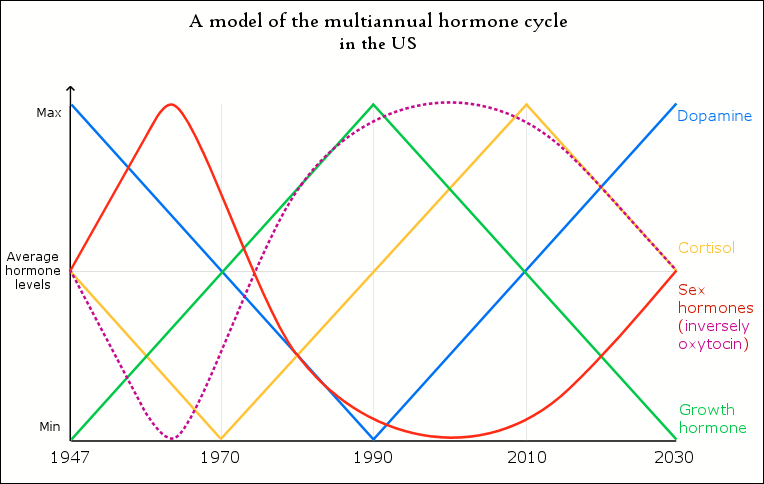
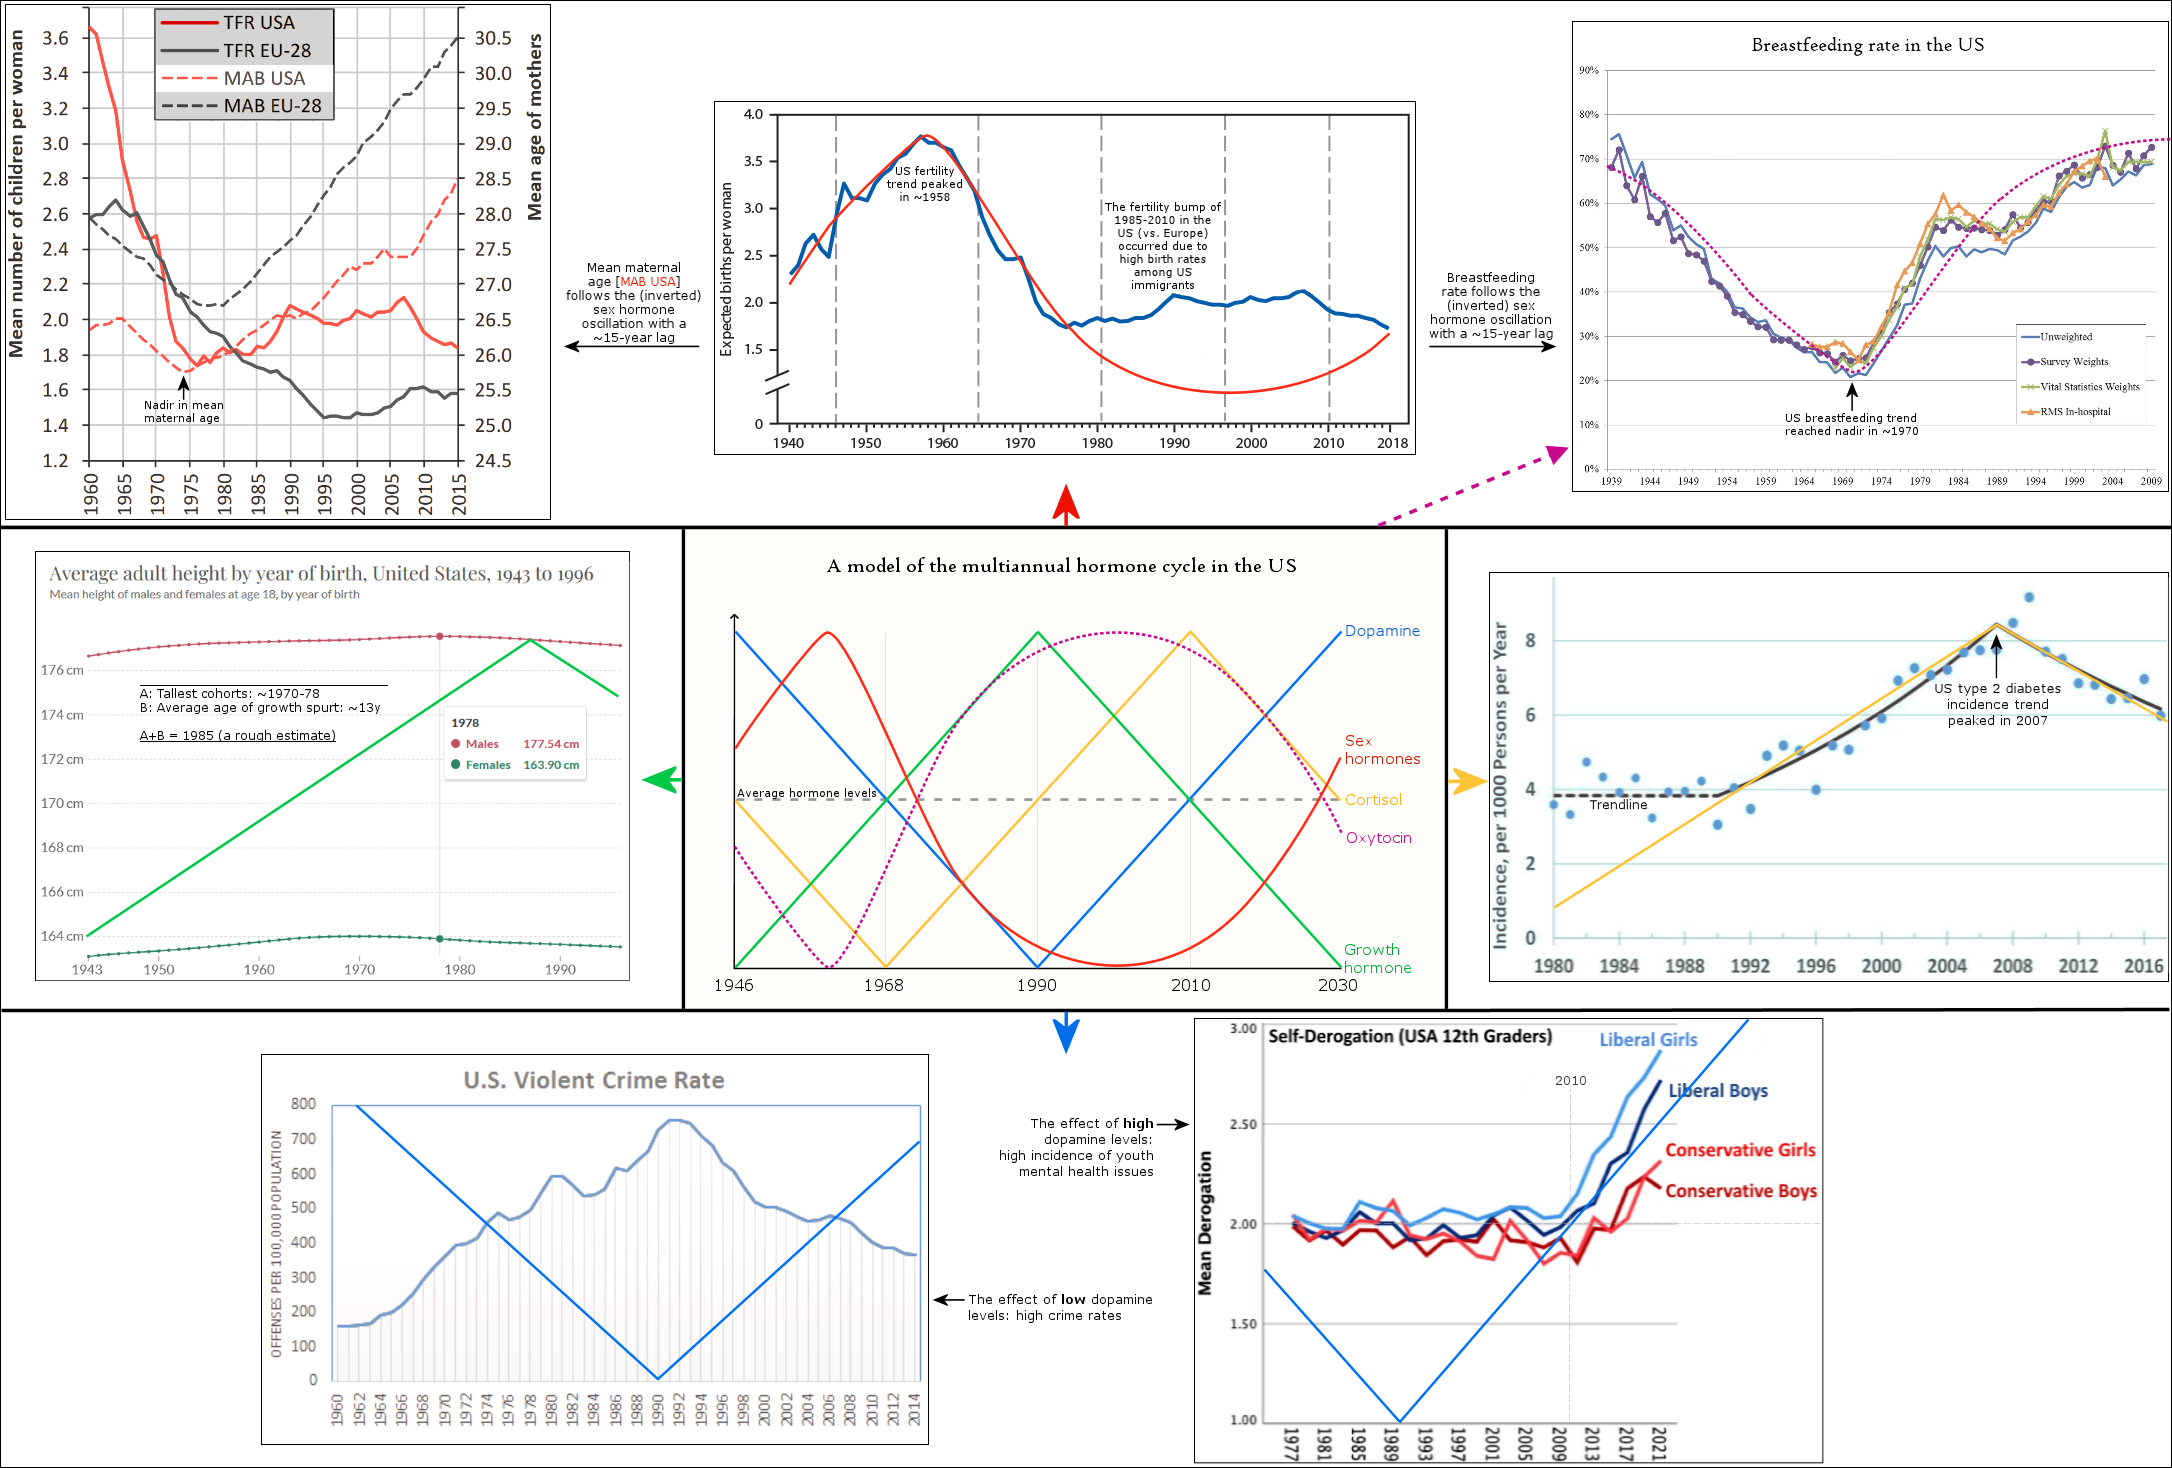
Below is a model of the cycle that is currently active among human populations, including the estimated years for the current cycle in the US. It is basically the same cycle that generates all of the periodic animal population cycles, with the exception of the sex home oscillation being more accurate and oxytocin being added to the cycle (inverse to sex hormones).
While the cycle’s oscillations are analyzed separately in subchapters 2.3-2.7, below are a few general examples that reveal the existence of the multiannual hormone cycle among human populations.
The first example connects the sex hormone oscillation to largely synchronous phenomena among the Western countries that originated first in the US and then in other Western countries with a lag of approximately 1-5 years. The geographic advance of these statistical phenomena resembles the ‘traveling waves’ of cycles inside animal metapopulations, where the population cycles often advance as a wave from the epicenter(s) of cyclicity.
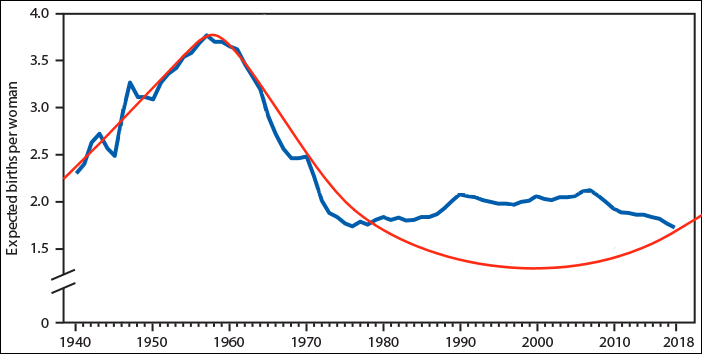
The average fertility rates in the US (blue line) peaked in 1958. The red line represents the multiannual sex hormone level oscillation.
European fertility rates peaked roughly 5 years later during the early 1960s (TFR EU-28).
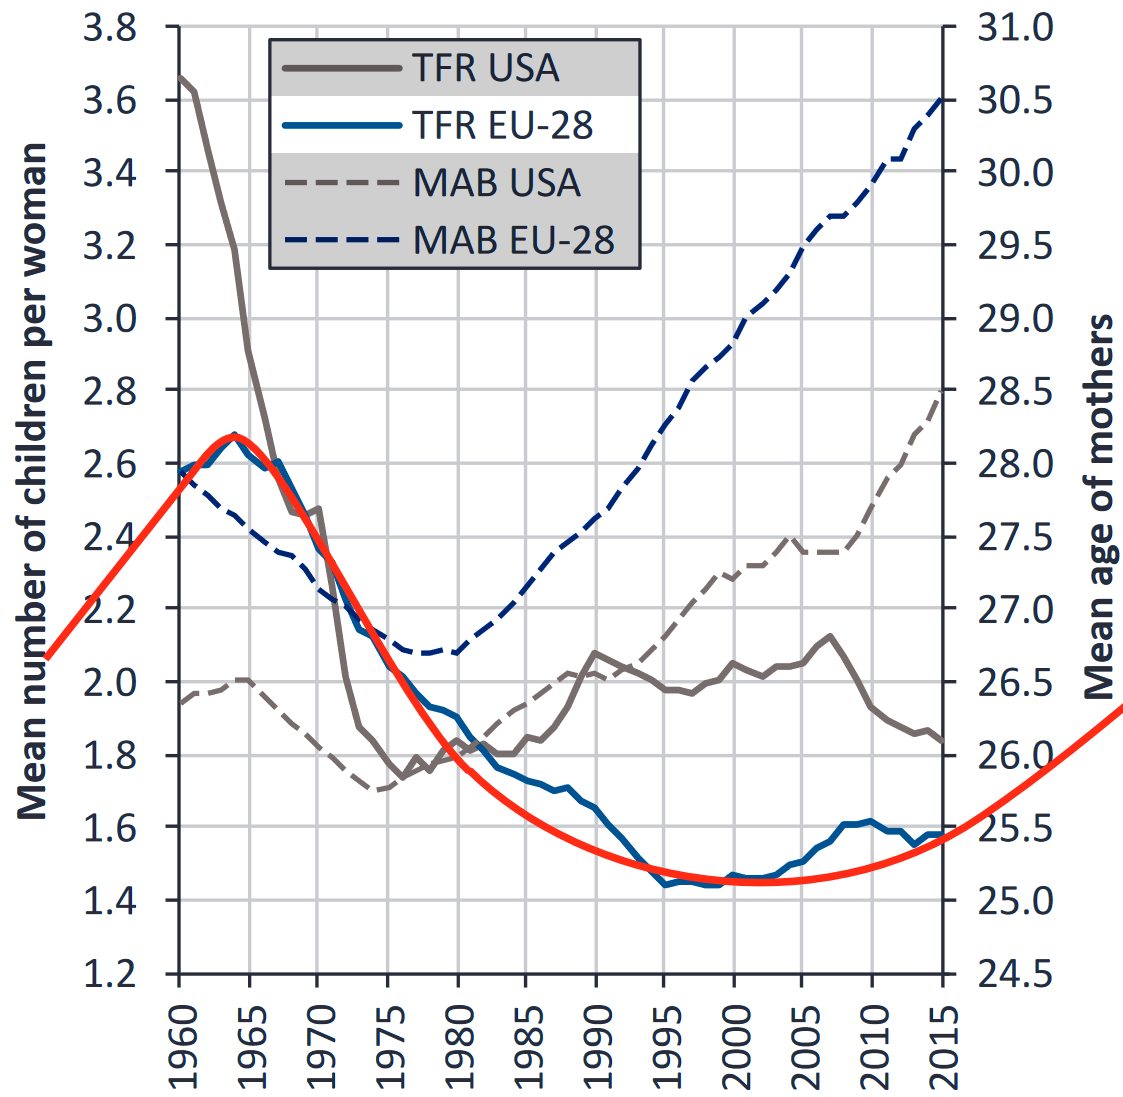
The statistic above shows another common phenomenon among the Western countries: the mean age of mothers at childbirth reached nadir during the 1970s, first in the US during the early 70s (MAB USA) and then in Europe during the late 70s (MAB EU-28).
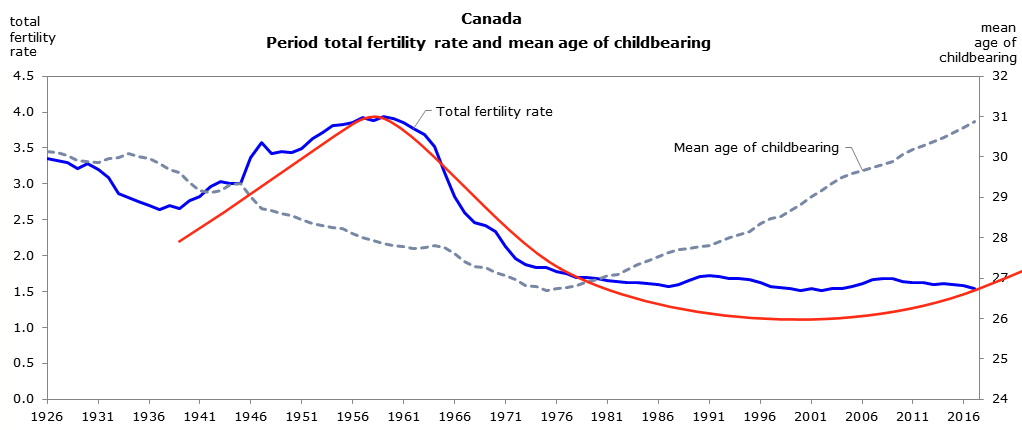
Statistics from Canada below show highly similar trends that are situated between the US and Europe. The fertility rate in Canada peaked during the late 1950s and the mean age of mother reached nadir in 1975.
According to these statistics, the multiannual hormone cycle’s sex hormone oscillation appears to have caused the ‘baby boom’, while the maternal age nadir of 1970s was due to the fast sexual maturation of teenagers during the 1950s and 60s.
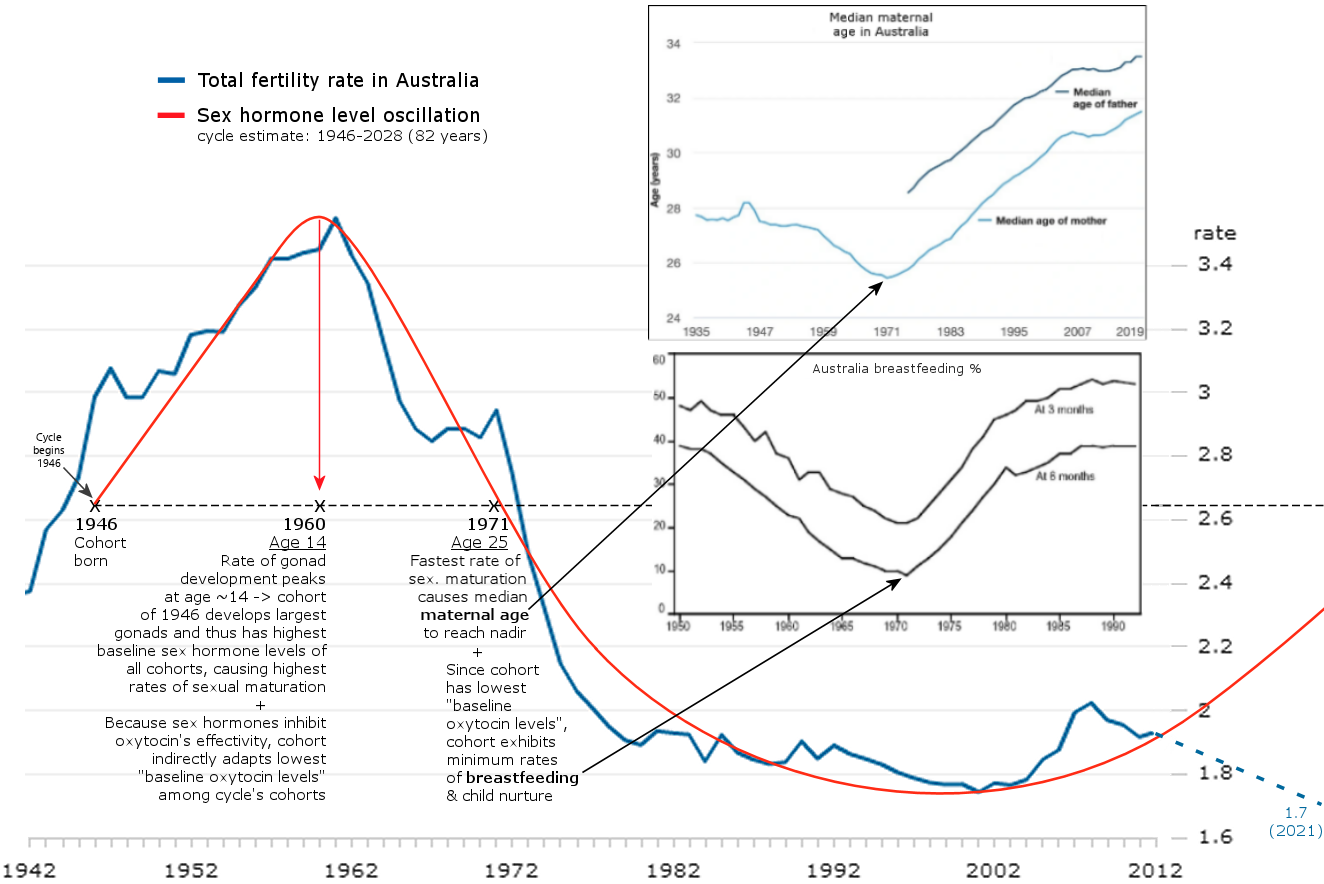
The graphic below visualizes the population-wide effects of the sex hormone oscillation in Australia, and also adds breastfeeding statistics to the mix. The graphic uses the cohort of 1946 as an example by following their development from birth to childbearing and breastfeeding.
In addition to the sex hormone oscillation, example statistics below reveal the cycle’s cortisol oscillation.
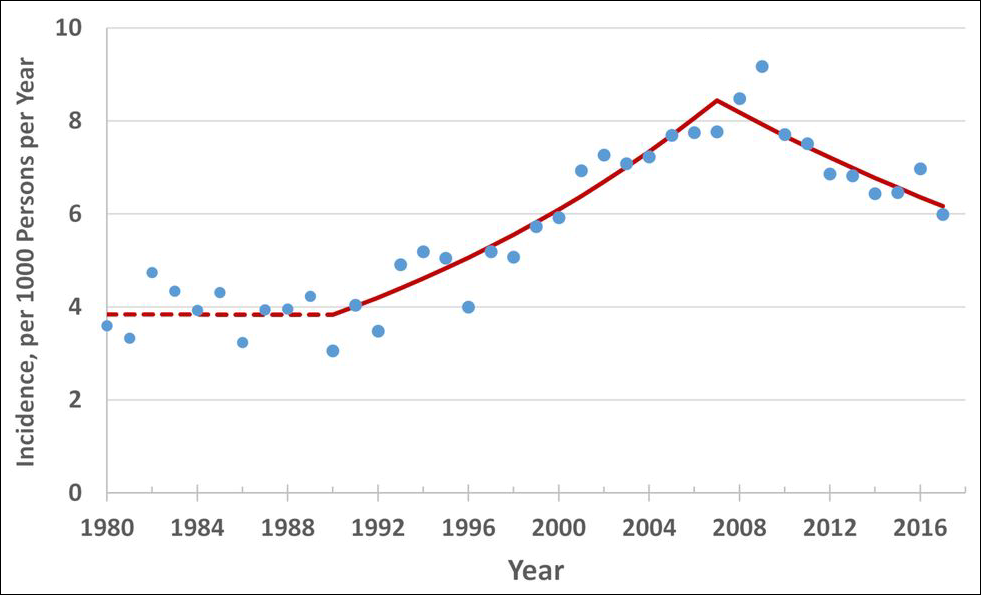
Cyclic vole and lemming populations exhibit the highest rates of diabetes during the 3rd phase of the cycle, which in turn would be approximately 2010 in the model made for Western populations. As overweightedness is the most important factor regarding the onset of type 2 diabetes in addition to having high cortisol levels, and overweightedness became more prevalent from 2000 to 2020 in all of the Western countries, it would seem unlikely that the incidence rates could have decreased during the 2010s.
But regardless of the obesity epidemic getting worse, the incidence of type 2 diabetes did peak very close to 2010 in the majority or Western countries, including the US, Canada, Australia, and most of the European countries. Meta-analyses have concluded that no changes to testing procedures or preventive health measures can explain the suddenly declining rate in incidence in any of the countries where the phenomenon occurred, meaning that no explanation exists for these statistical anomalies.
The last graphic compiles US statistics connected to the sex hormone level oscillation, and adds height (growth hormone) and violent crime (dopamine, inverted) statistics for a complete view of the multiannual hormone level oscillations. Because sex hormones inhibit oxytocin, the cohorts undergoing the fastest sexual maturation also have the lowest oxytocin levels, causing a simultaneous nadir in breastfeeding rates and parenting intensity.
In addition to statistical evidence, many historians have detected generational cycles in history, including Polybius during the second century BC, this hypothesis also presents historical evidence that is in support of the multiannual cycle. The most coherent and detailed theory of generational cycles is the ‘Strauss-Howe generational theory‘.
2.1.2 Generational cycles detected by historians
Human populations are presented to undergo the same periodic multiannual hormone cycle as other cyclic animal populations. The probability of this is relatively high due to an estimated 70% of mammalian species having cyclic populations. (Kendall et al., 199815)
A historical cycle theory named as the Strauss-Howe generational theory describes an approximately 80-year generational cycle having repeated for centuries in the US. (Karashchuk et al., 2020132; Costanza et al., 2023133) Each of these four generations have their typical average behavioral traits and developmental paths – which resembles the four repeating generations of the animal population cycles – and the generations always appear in the same sequence: “As we examine these pendular movements [of American generational history], a startling pattern emerges: a recurring cycle of four distinct types of peer personalities, arriving in the same repeating sequence.” (Generations, Strauss & Howe, 1991134)
Strauss & Howe are not the only ones to have noticed a repeating generational pattern in human history. For example, historian Jack Goldstone has observed a similar centuries long generational pattern manifesting in Eurasia: “Goldstone was also encouraged by the publication in 1978 of Colin McEvedy and Richard Jones’s Atlas of World Population History, in which they highlighted an “astonishing synchronicity” in population booms and busts across Eurasia over millennia. A few months into his number-crunching, he had his eureka moment: “It was astounding: there really was a three-generation surge in population growth before every major revolution or rebellion in history.”” (S)
Other historians, including Arnold Toynbee and Quincy Wrigth, also have located similar cyclical generational patterns in history. Strauss & Howe note that the renowned political philosopher Polybius discovered a similar generational cycle during the second century B.C. when he studied the histories of Greco-Roman city-states.
Because many of the Strauss-Howe generational theory’s generationally oscillating traits correlate with the oscillating behavioral traits found in other cyclic animal populations, it is plausible that the Strauss-Howe generational theory is in fact a description of the multiannual hormone cycle’s societal effects in the US and other countries.
Chapter 2 presents a generational hormone theory and presents a wide range of statistical evidence from several Western countries to establish that these countries are currently undergoing a multiannual population-wide hormone cycle. Below is the basic model of the generational hormone cycle in the US and other Western countries.
This chapter details how the population-wide hormone level oscillations imprint weighted behavioral trait differences into generations as they undergo developmental periods, cohort after cohort.
Although the cohorts undergoing significant developmental periods are affected the most, the social mood of entire countries is concurrently modulated by the concurrent hormone levels of the cycle. For example, the oscillating dopamine levels create eras of increased polarization and nationalism through increasing/decreasing feelings of social dominance and in-group cohesion; a phenomenon that appears to manifest approximately every 80 years in many Western countries, while this era is usually preceded/followed by some four decades of relative cosmopolitanism and liberalism.
All of these different eras and generations will be reviewed, but as they have already been presented extensively by historians William Strauss and Neil Howe in their books Generations and The Fourth Turning, the larger goal is to review how hypothalamic hormone levels modulate social behavior and how these hormones are linked to the Strauss-Howe generational theory of 4 x 20 year generations. While there are many other hormones that affect behavior apart from the hypothalamic hormones, they are not taken into account in this hypothesis, as they are more “downstream” compared to the hormones secreted from the hypothalamus that is called the master gland, because it controls the development of other glands and their secretion rates.
It is important to note that this hypothesis does not suggest that any singular historical events have happened because of certain average hormone levels. Instead, what this hypothesis suggests is that generational hypothalamic hormone levels may have modulated the average behavioral traits of generations that affect their average actions and reactions, and also the social mood during different eras.
To better explain the generational hormone cycle’s behavioral effects, an example of oscillating hormone levels creating oscillating behavior is the menstrual cycle: women in their reproductive years tend to have mood swings during their menstrual cycle that are caused by oscillating hormone levels, and then react to their environment according to their current mood, like with increased anxiety, depending on the phase of the cycle. The menstrual cycle also has an oscillating effect on memory and spatial skills for instance, demonstrating that changing hormone levels impact both behavior and cognitive skills, and also the structure of the brain according to the phase of the cycle. (Pletzer et al. 2019135)(S)
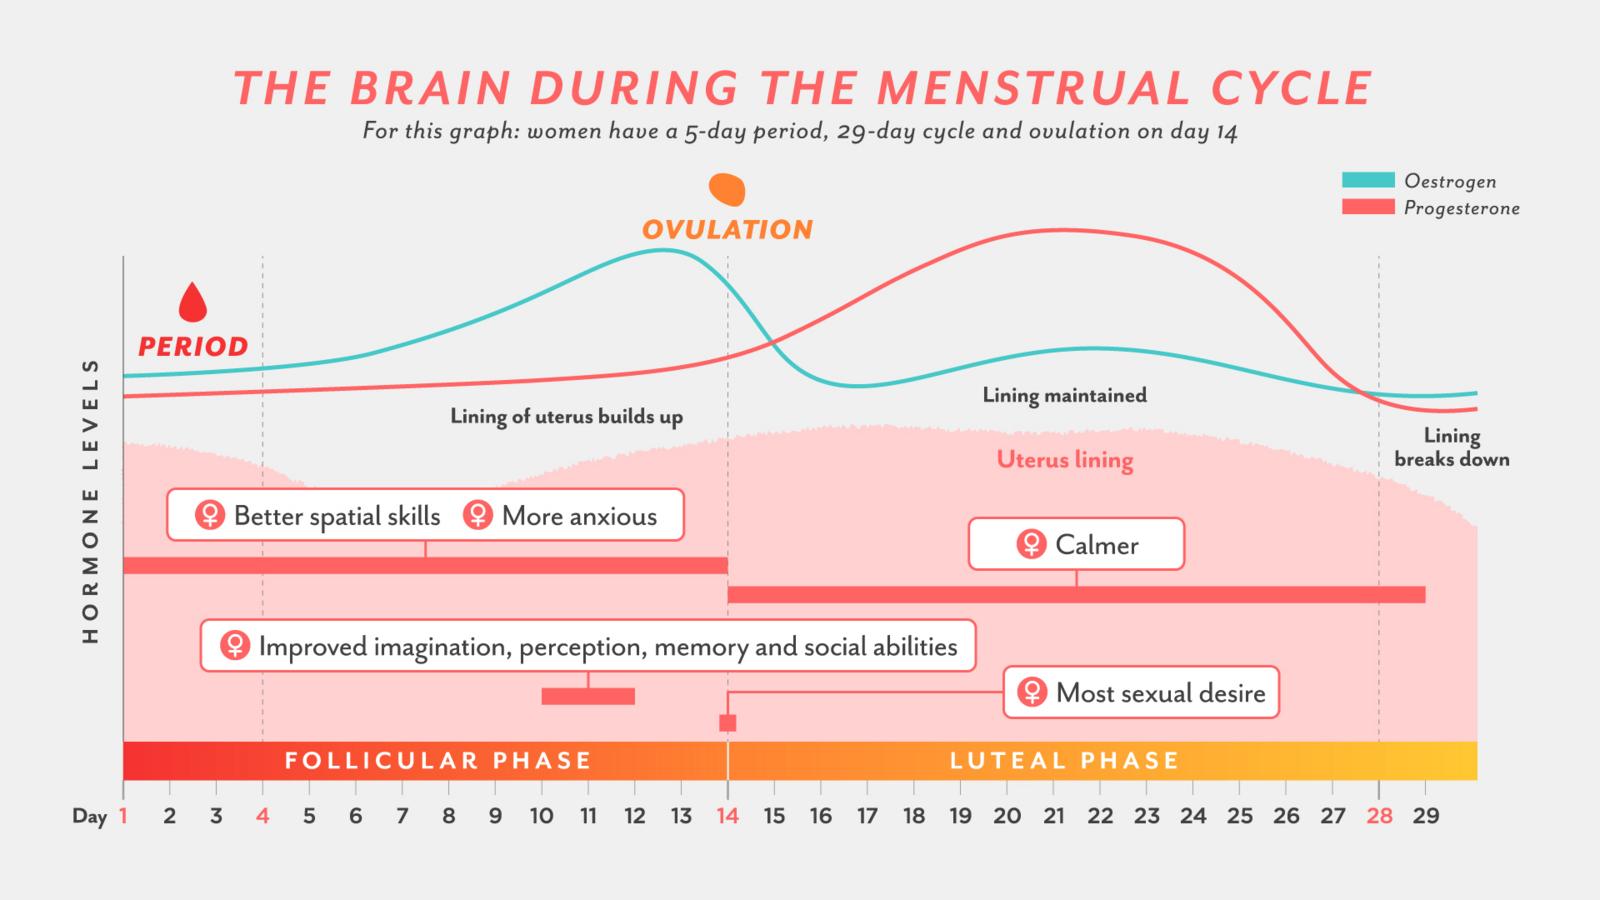
Even though menstrual synchrony among women is still a debated subject (S), if the synchrony was occurring, it would mean that there would be also behavioral and physiological trait synchrony among these women during different phases of the month. This is essentially the same thing that the presented generational hormone theory is suggesting to be occurring in an 80 year long cycle while the generational hormone cycle is active in a human population: birth cohort specific average hormone levels affect each birth cohorts development and average behavioral & physiological traits, and many of these generationally oscillating traits are listed in the Strauss-Howe generational theory. And like the menstrual cycle, that is controlled by a multi-oscillatory circadian system, the generational hormone cycle is presumed to have different phases with different hormone level configurations. (Simonneaux & Bahougne, 2015136)
In Western human populations the cycles are presumably in annual synchrony within the countries, but between the countries it appears that a traveling wave is starting from the US, then traveling north to Canada, east to Western Europe, and from there further east and also to the south, including Spain, that lags the Western Europe’s phase by a few years in statistics, while many Eastern European countries are lagging by roughly 5-10 years. Russia lags by about 15 years behind the US in the presented statistics. Mammalian populations located between northern latitudes 30 and 70 exhibit cyclicity most commonly, while those latitudes also include all of the Western nations on the Northern Hemisphere and Russia too. (Kendall et al., 1998/200215)
2.1.3 Overview of chapters 2 & 3
Chapters 2.1.4 and 2.1.5 present the Strauss-Howe generational theory’s generational cycle in more detail; 2.2.1 reviews statistical evidence of generationally oscillating sex hormone levels and links them to fertility rates; 2.2.2 links generationally oscillating sex hormone levels to childlessness rates; 2.3 reviews statistical evidence of generationally oscillating growth hormone levels; 2.4 reviews statistical evidence of generationally oscillating cortisol levels and links them to type 2 diabetes incidence rates; 2.5.1 reviews how time spent with children and breastfeeding rates are linked to the parent’s oxytocin levels; 2.5.2 reviews changing alcohol consumption rates in history; 2.6.1 reviews proxy statistics to find generationally oscillating dopamine levels; 2.6.2 ties eras of high/low social dominance and in-group cohesion to generationally oscillating dopamine levels; 2.6.3 reviews how generational dopamine and oxytocin levels possibly modulate the average voting behavior of birth cohorts.
Chapter 3.1 lays out the current societal trends of increasing inter-group cleavages and tensions, and highlights the inability of sociology to explain the growing inter-group tensions; 3.2 is a short introduction to how hormone levels are related to individual and group behavior; 3.3 connects the effects of increasing dopamine levels to increasing “in-group vs. out-group” tensions on a societal scale; 3.4 presents the universally common paths that small and large groups typically undergo when social dominance increases and in-group cohesion tightens; 3.5 ties the biological roots of scapegoating to increasing in-group empathy.
Genetic factors of individuals are confined out of this hypothesis, since on a level of a population the genetic differences between individuals and generations are evened out. Hormone receptor SNPs are negated at this point for the same reason. There are differences in the mean genetic and SNP distribution between nations and continents, but for the moment, this fact is left aside, although it is very relevant in the context of population-scale behavioral differences between different geographic locations. (Allocco et al., 2007137)
Transgenerational epigenetic effects are left aside for now, because they are more case sensitive, but could theoretically contribute to the generational traits in some ways, since stress receptivity of generations presumably changes during the cycle. And since hormones act as epigenetic signals in development, epigenetics are taken into account, but not in a transgenerational way for now. [In 2019 this hypothesis included a theoretical framework on how the fluctuations in hormone levels might be due to epigenetic effects between generations, but this framework was abandoned due to several reasons, one of them being that it would be highly unrealistic for such a epigenetic cycle – for all hypothalamic hormones – to manifest as coherently as what the cycles have been documented to be between different species and also different environments.]
Differences in hormone effects between sexes are currently mostly negated, but will be implemented later on. Biologically the proposed human generational hormone cycle is very similar to the documented lemming and vole generational hormone cycles. Because functions of the hypothalamus have been tightly conserved through the mammalian evolution, this makes findings from rodents largely translatable to humans. (Caldwell & Albers, 2015138)(S) Hypothalamic hormones have a multitude of physiological and behavioral effects in different species, but only those hormone effects are accounted for that have 1) behavioral effects relevant to this hypothesis and 2) physiological functions that are used to find historical hormone levels by using proxy statistics (like breastfeeding statistics for oxytocin).
This hypothesis is a personal project and a byproduct of research conducted while planning for a master’s thesis in 2018. The planning included reviewing how hormone levels are connected to empathy and aggression, while simultaneously reading about the Strauss-Howe generational theory, and then evaluating if generational hormone levels could explain the generational differences in typical behavior depicted by the Strauss-Howe generational theory. The writing of this hypothesis begun without any other specific aims than to find out if there could be generationally oscillating hormone levels in the Western human populations, but a 2019 discovery of there being highly similar generational hormone level oscillations in cyclic animal populations to what was already modeled for human populations based on the Strauss-Howe generational theory essentially transformed this hypothesis into an evolutionary biology hypothesis.
Sources used are mainly from the fields of neurobiology, neuropsychology, animal ecology, chronobiology, and history of human populations. Quotes are used to underscore some of the most important aspects of the biological and historical evidence central to this hypothesis. Because the text is a work-in-progress, at times it may include some incomplete paragraphs or sentences.
2.1.4 Generational hormone theory
To recap the premise of the generational hormone theory: most Western countries have generationally oscillating hormone levels that modulate the average behavioral and physiological traits of Western generations, and that these are the generational behavioral traits listed in the Strauss-Howe generational theory regarding the Anglo-Saxon generational history. The generation hormone theory essentially provides a biological basis for the S-H generational theory by connecting A) the S-H theory to B) societal proxy statistics and C) other documented animal population cycles.
Especially dopamine and oxytocin are at the center of the generational hormone theory, as both modulate group behavior, especially group cohesion and the ‘in-group vs. out-group’ setting: oxytocin modulates cohesion of small groups (e.g. family, friends and other close social connections), while dopamine modulates cohesion of large groups and social dominance. (Pearce et al., 2017139; Matthews et al., 201670;Lewis et al., 2010140; Lewis & Bates, 2017141)(S)(S)
These oscillations to social dominance and group cohesion follow the Strauss-Howe generational theory’s 80 year cycle of oscillating group cohesion. For example, sex hormone levels modulate fertility/infertility rates and sexual behavior, while growth hormone levels modulate feelings of confidence and self-esteem.
The graphic below combines the ‘social mood’ table from the S-H generational theory with the multiannual hormone cycle to show how the ‘social mood’ oscillations listed in the Strauss-Howe generational theory are driven by the multiannual hormone level oscillations.

* A cohort adapts their baseline sex hormone levels [red oscillation] as teenagers. Due to some sex hormones’ (e.g. testosterone) inhibiting effects on oxytocin, a cohort simultaneously adapts oxytocin levels [dashed pink line] that are inverse from their sex hormone levels. This causes a ~15y lag for ‘Child Nurture’ and a ~25y lag for ‘Families’, because there is (on average) a ~15y gap between teenage years and raising small children, and an additional ~25y for those children to grow up and have their own offspring. (Open full size image)
The generational hormone theory aims at binding these hormone’s behavioral effects into societal phenomena, especially large-scale in-group vs. out-group behavior, and presents that historical eras of heightened nationalism are possibly linked into generationally oscillating hormone levels that modulate nationalistic behavior.
The historical observations made throughout the generational hormone hypothesis are made only to create a link between 1) presumed changes in generational hormone levels in human populations that are similar to the animal population cycles and 2) the Strauss-Howe generational theory, but not to suggest that hormone levels in some way have created historical events. From the viewpoint of sociology, the generational hormone theory takes both micro and macro levels of societal change into account by looking separately at individual and group behavior, both of which are modulated by hormone levels.
2.1.5 The Strauss-Howe generational theory
During the 1980s, historians William Strauss and Neil Howe begun researching for a book regarding the history of the US generations. The first book , Generations, presents the four archetypal generations and the 80-110 year generational cycle (1991 C-SPAN interview), and in 1997 they released The Fourth Turning that went even further in describing the details and dynamics of their theoretical generational cycle. (1997 C-SPAN interview) According to the interviews of these generational historians, before their collaboration begun, both had independently come across the repeating generational cycle in their own research, and only after this they met and combined their research towards a common goal of presenting the history of the US generations utilizing the generational cycle they had discovered. (S)
The Strauss-Howe generational theory details a four generation cycle, that goes back in history roughly at intervals of 2030-2010 | 2010-1990 | 1990-1970 | 1970-1950, etc., with each of the repeating four generations having distinct individual and group behavioral traits. (Karashchuk et al., 2020132) (The years are approximations and vary slightly between the books and the presented generational hormone theory, since the books are based on historical observations while this theory is based on a biological cycle.) From the standpoint of this hypothesis, the biggest flaw the Strauss-Howe generational theory is that the authors explain the cycle’s four generation’s traits mainly through a) intergenerational social dynamics and b) societal events having a profound effect on generational behavior, so the proposed mechanism is somewhat similar to the old hypotheses claiming that animal population cycles are caused by environmental variables and interactions.
The four generations of the 80-year cycle are introduced next, and then it is explained how they form a repeating cycle of 80 years in total like William Strauss & Neil Howe have documented in their books including Generations (1991) and The Fourth Turning (1997). (S) One full 80 year cycle is called an ‘Anglo-American saeculum’, and the repeating four generations span all the way back to the 15th century England. Even though this chapter presents a lot of historical claims, the sources and quotes are not presented to be indisputable facts, but instead are used to construct a “bridge” between the Strauss-Howe generational theory’s cycle and the presented generational hormone cycle in the Western nations, which in part is similar to the generationally oscillating metapopulation-wide hormone levels of cyclic animal populations.
Strauss & Howe use the word ‘turning’ to describe a roughly 20-year long phase. A 1st generation is born during a 1st turning, and that generation is the Boomers in the current generational cycle. The generations and their traits were easily observable during the 20th century (Baby Boomers, Generation-X, Millennials) in most Western nations, especially in the US, due to the increasing societal freedoms and consumerism of the past century. Changes to youth culture mostly generated in the US and spread on from there to other Western nations that were receptive to these movements, presumably by them having similar cyclical hormone levels (as is presented later on).
The most volatile point in the 80 year Strauss & Howe generational cycle has historically been the 4th turning, when a 1st generation, the so called Prophet/revolutionary generation (Baby Boomers in the current cycle), is largely holding the places of maximum civic and economic power. Historically, this has often been a time of societal turmoil: old beliefs of social dominance are challenged, group cohesion tightens, institutions are reshaped to serve new goals, and the status quo inside and between societies is changing rapidly towards the end of a 4th turning.
Below are short descriptions of the four turnings accompanied by short quotes from the book The Fourth Turning, and brackets indicate the generation undergoing childhood during that era.
The 1st turning (approx. years of birth for boomers are 1943~1960): “An upbeat era of strengthening institutions and weakening individualism, when a new civic order implants and the old values regime decays.” The society is unified and there is optimism about the future, institutions are trusted. The society eventually starts a movement towards globalism and liberalism, but nationalistic pride is still strong. A 1st generation is born into an era of tight group cohesion, and is a more optimistic, daring and selfish generation than the previous 4th generation. This sense of optimism has been observed even in the offspring of holocaust survivors. (S) A 1st generation is historically the populist generation once they gain major political power during the 4th turning.
The 2nd turning (Generation X 1961~1981): “A passionate era of spiritual upheaval, when the civic order comes under attack from a new values regime.” In a second turning the 1st generation leads the youth revolution and the more rigid nationalistic culture of a 1st turning makes way for a strong culture of liberalism, much through 1st generation young adults. A 2nd generation is born and raised very loosely, becoming a generation of independent individuals, driving the rise of individualism in their young adulthood during the next (3rd) turning.
The 3rd turning (Millennials 1982~2003): “A downcast era of strengthening individualism and weakening institutions, when the old civic order decays and the new values regime implants.” When a 3rd turning begins, the family structures are weak, individualism is strong, and anti-social behavior like crime is common. A 3rd generation is born into a relatively peaceful liberal world, and they become more cosmopolitan in their ideological views than the previous two generations. General trust towards institutions begins to decay, and this accelerates during the next (4th) turning.
The 4th turning (Generation Z 2004~2024): “A decisive era of secular upheaval, when the values regime propels the replacement of the old civic order with a new one.” In a 4th turning the 1st generation enters positions of most political power and nationalistic cohesion (or divide) tends to reach its peak towards the end of the turning (different paths are assessed in chapter 3.4). (S) The 1st generation with their confidence and capital power tend to drive the economic bubbles to new heights before a bust, like in 1929 and 2007. (S) Group cohesion increases, ideological sides are being chosen at an accelerating pace, and cooperation among (possible) opposing factions of society deteriorates. This crisis era will basically either unify or divide a society even further. Information outlets and individuals with large audiences, like celebrities, begin to weigh in their opinions more and more in the increasingly polarized public ideological debate. A 4th generation is born, they are sensitive, and their view of the future is not very bright, just like today’s youth is often referred to as “snowflakes” by the older (and also bolder) generations. “The social mood changes” Strauss & Howe often remind their readers of what happens in a 4th turning once the so called crisis era begins.
It should be noted that terms that describe human ideology and behavior, like nationalism and globalism are only social constructions that are always tied to their historical context. Nationalism and globalism could be replaced with terms of tribalism and cosmopolitanism or some other way to convey the idea of a society’s social cohesion and a society being more open/closed to outside groups. The effects of hormones on ideology cannot therefore be bound too much to any terms of language, since generationally oscillating hormone levels manifest in different ways depending on the point in history, be it a feudal kingdom in 12th century England, a Germanic tribe in 15th century, or a nation belonging to the EU in the 2020s. But since the phenomena of increasing nationalism or cosmopolitanism share common elements throughout history, the terms nationalism and globalism will be used to differentiate historical eras of either low or high group cohesion in cyclic human populations.
Since hormones act as epigenetic signals in development, the presumed hormone cycle presumably modulates the average phenotypes of generations, resulting in synchronized average generational behavioral and physiological traits. (Fowden & Forhead, 2009142) This would result in generations to have their unique generational behavioral phenotypes when comparing different generations inside one full cycle. (Crawley, 2008143)(S) (The term ‘behavioral phenotypes’ has sometimes been used to describe mental illnesses, but here it is used to describe the presumed average behavioral traits of generations.) There obviously are differences between hormone levels (and DNA) of individuals, but analyzing a generation as a whole averages out the individual differences and revels their average behavioral traits. As most people are married to and have a majority of their friends from their own generation, this increases the effects of generational hormone levels to individual and group behavior through behavioral synchrony.
To establish the premise that succeeding generations in Western countries have different hormone levels at different stages of their development, chapter 2 presents statistical evidence of generationally oscillating hormone levels in the US and other Western countries. Eastern countries, such as Russia and China, are also looked at briefly, as their statistics appear to be lagging the Western countries by roughly 5~15 years.
Even though oxytocin, dopamine, growth hormone and cortisol levels are detected using proxy-statistics, these statistics may actually be a more accurate indicator of societal hormone levels than direct measurements, since societal proxy-statistics can provide decades of longitudinal data. Decades of statistics can reveal average cohort-specific hormone levels.
If the hypothalamic neurosecretory neurons are small and ineffective, physiological and behavioral actions like breastfeeding do not manifest like they would if the hypothalamic neurons were large and effective: oxytocin is released from the hypothalamus when a baby sucks on the mothers nipple, but if enough of oxytocin is not released, breastfeeding does not initiate. Therefore, breastfeeding statistic will be used as a proxy for concurrent societal oxytocin levels.
2.2 Generational sex hormone levels
2.2.1 Maternal and paternal age
This chapter reviews the effects of the 80 year generational hormone cycle to the human reproductive system. Most Western nations have seen low birth rates during the 2010s and infertility is more common than before, and poor sperm quality is the cause in most cases. (S) Sperm counts have also decreased significantly during the past decades with drops of 50% in many countries during the past 40 years. (Levine et al., 2017144) This has been accompanied by falling testosterone levels and the younger generations having less sex than the Baby Boom and Gen X generations. (Travison et al., 2007145)(S)(S)
Phase II generation below, roughly representing human birth cohorts who are in their reproductive ages during the first half of a 4th turning, shows greatly diminished size in the lemming gonadotropic cells, which has resulted in less sex hormones and therefore much smaller testes compared to the phase I and phase III cohorts.

The same increases in both sex hormone levels and testicular size has been documented in the cyclic snowshoe hare populations, and the population decline phase is associated with lower levels of sex hormones. (Davis & Meyer, 1973146) Human male testicular size is therefore presumably lower for the age cohorts in reproductive ages during a 4th turning, which would have a negative effect on sperm quality (Condorelli et al., 2013147) and testosterone levels, which is in line with the current situation in the Western nations. Therefore, the sex hormone oscillation is adopted as is from the model of the generational hormone cycle for the cyclic animal population, and the cycle begins from the year 1950 according to the Strauss-Howe generational theory (in reality a few years earlier, but the years are approximations of a 80-85 year cycle).
Presuming that the sex hormone levels have peaked in the 1960s, causing faster sexual maturation and thus lowest maternal and paternal age some 10 years later, there seems to be a high degree of correlation between several Western countries of the maternal age reaching a low point during the 1970s: US (S), UK (S), Canada (S), Australia (S), Denmark (S), Austria (S), Netherlands (S), Norway (S), and France (S) all show very similar statistics with low points occurring close to the year 1970. (In the US nadir was close to 1965, slightly earlier than in other countries, due to US fertility peaking in the 1950s.) Japan is showing a similar but less pronounced effect with only a minor decrease in maternal age (S), which is similar to the breastfeeding statistics from Japan that are also less varied when comparing to the other countries presented.
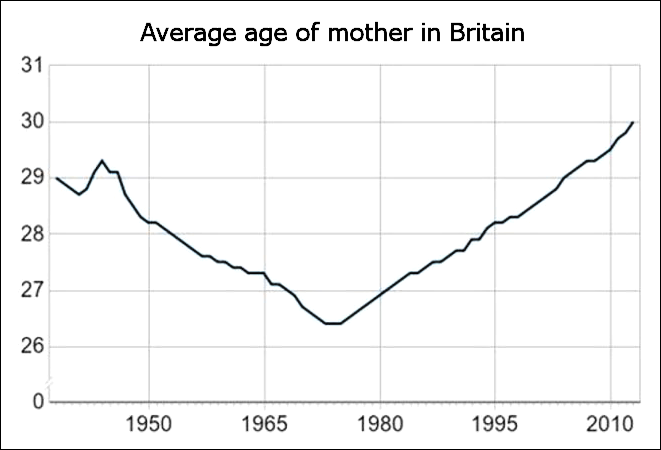
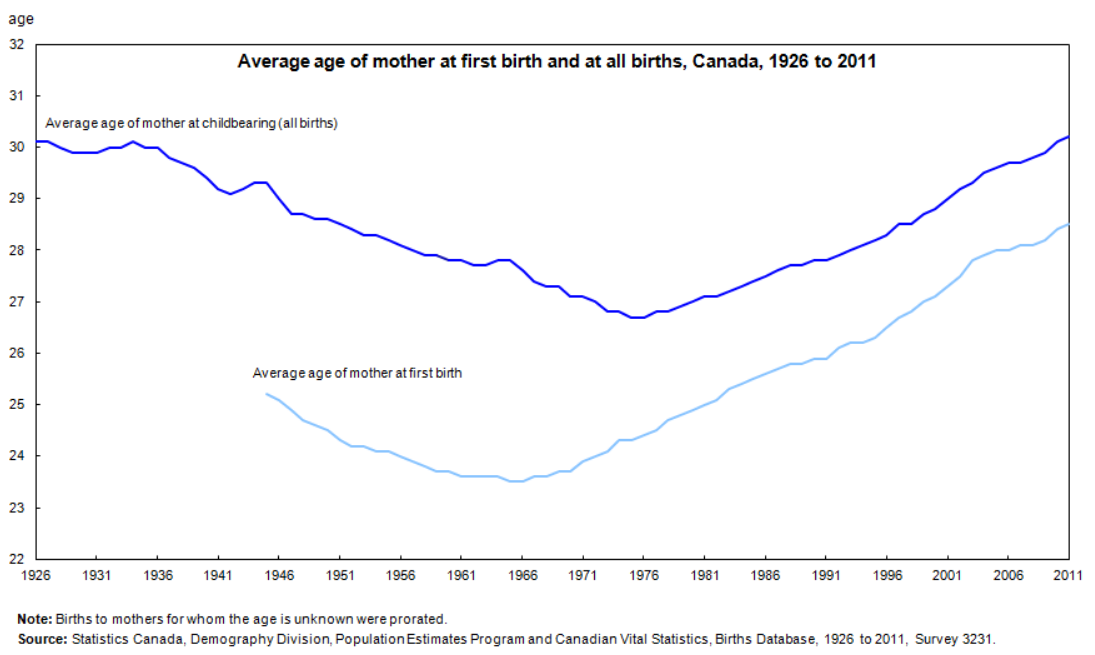


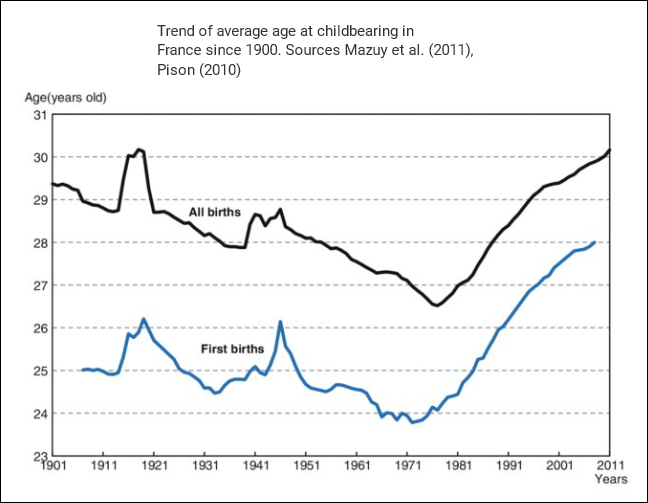
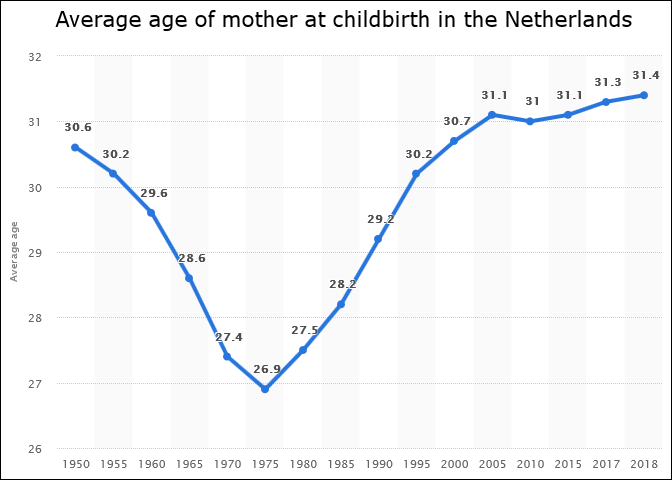
The similarity between these statistics is very apparent, and they also share a high degree of similarity with the breastfeeding charts.
Previous statistics have taken only mothers into account, but the statistic below of average paternal age show yet again a very similar curve when compared to the maternal age and breastfeeding statistics. (S) Men become fathers being a few years older than women on average, which is why the stats lag a few years from the statistics of maternal age. (S) The graph is very similar to the maternal ages presented before with the lowest point being during the 1970s, with only a few European countries lagging behind: Russia, Poland, Hungary, Estonia, Czech Republic from the east and Spain from the south. (S)
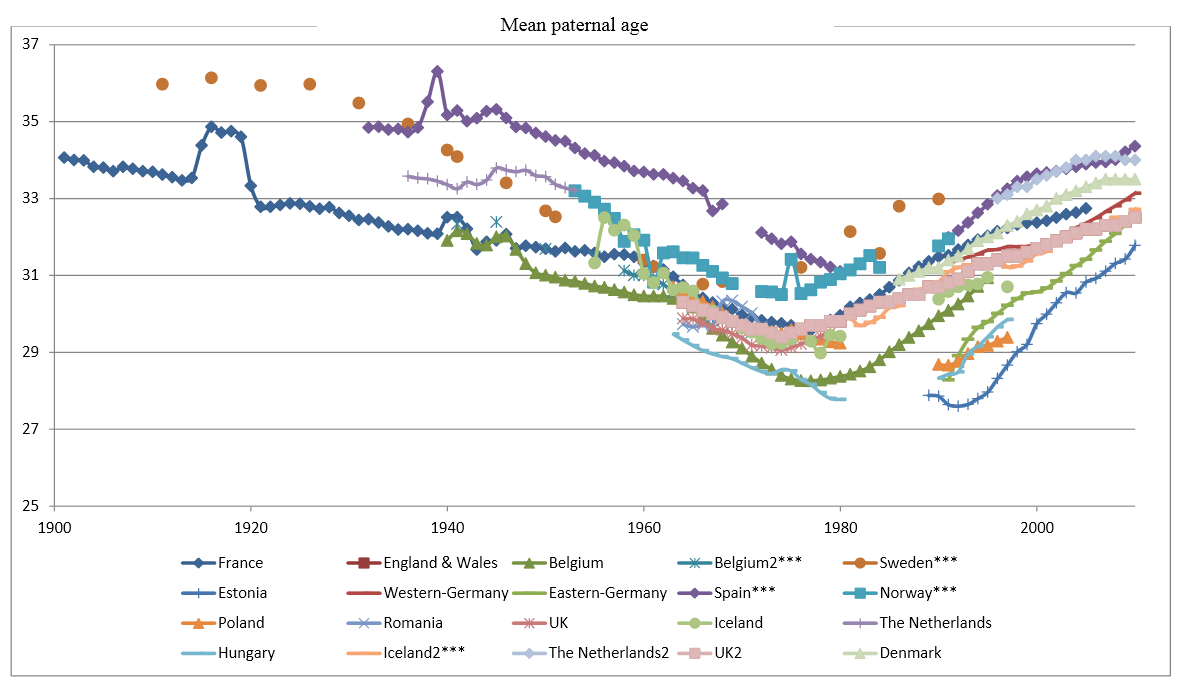
Having children later in life is very similar to the lemming cycle, since they mature sexually later after the peak phase of their cycle. (Erlinge et al., 2010148)
As for other possible explanations why the maternal age has risen from the 1970s, a commonly held belief by many in the field of sociology is that labor force participation percentage of females would somehow affect the age when women have children. But looking at longitudinal statistics from the US, Canada, and the UK, it is quite evident that these statistics have little in common with the maternal age statistics presented in this chapter. This implicates that the commonly held belief of female labor force participation affecting maternal age (on a scale previously suggested) is likely a false belief.
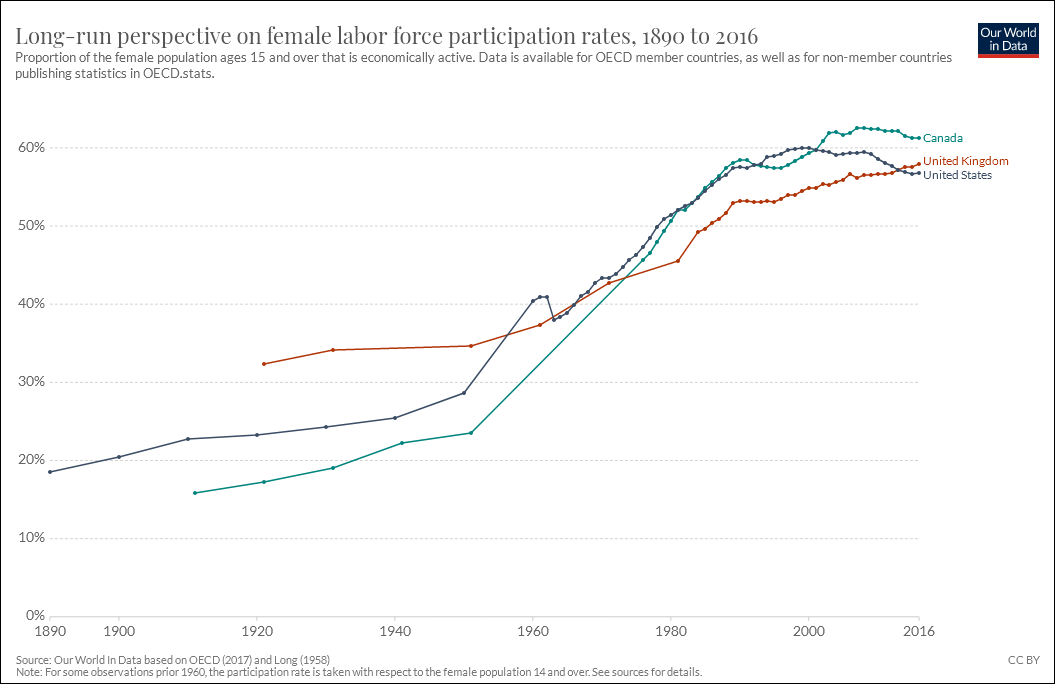
2.2.2 Fertility & Childlessness rates
For women, low estrogen levels can produce many of the same symptoms that low testosterone levels cause for men, including low sex drive infertility. (Weiss & Clapauch, 2014149)(S) Lower estrogen levels may be the cause for why many women in fertile ages have remained childless during the 2010s and 20s. This is a similar trend compared to ~80 years ago during the 1930s and 40s, when many women born during the early 1900s were childless.
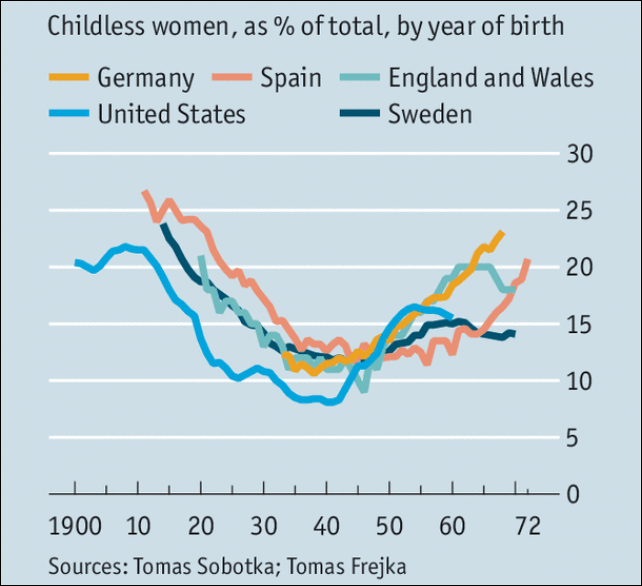
It should be noted that the curves between the countries correlate quite tightly, with Spain lagging by a few years with its low point, just like with Spain’s paternal age statistics (chapter 2.3.1) were lagging by about 10 years when compared to statistics from the US and the UK.
The statistic below shows childlessness levels being in relative synchrony among large geographical areas in Europe, and once again the central and eastern parts of Europe are lagging the US by about 5-10 years. New Zealand shares a highly similar curve regarding infertility by birth cohort. (Boddington & Didham, 2009150)

Combining the proxy statistics of presumed sex hormone levels produces the model below, which presents the final hormone levels birth cohorts have received during their development of gonads, which occurs primarily between ages 10 and 20.
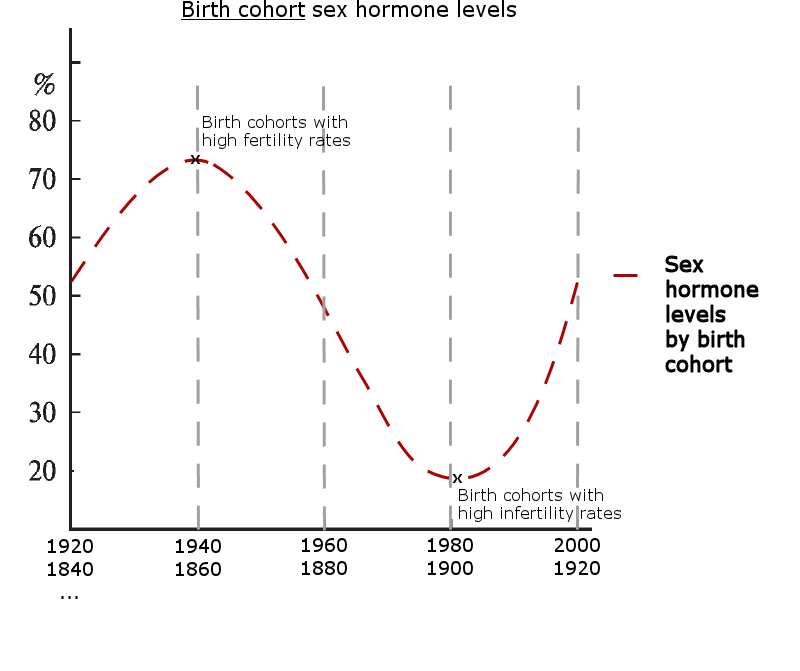
The effects of low/high sex hormone levels manifest as fertility/infertility roughly 10-15 years later when the cohorts are at peak reproductive ages (which occurs earlier for the cohorts with higher levels of sex hormones).
The statistic below illustrates that the trend of childlessness by birth cohort does follow the presumed hormone levels in the US and Australia at least to a degree. (Gobbi, 2012151) The added red line indicates the childlessness levels that are predicted by the generational hormone theory. The red line is an inverted line of the previously presented ‘sex hormone levels by birth cohort’.
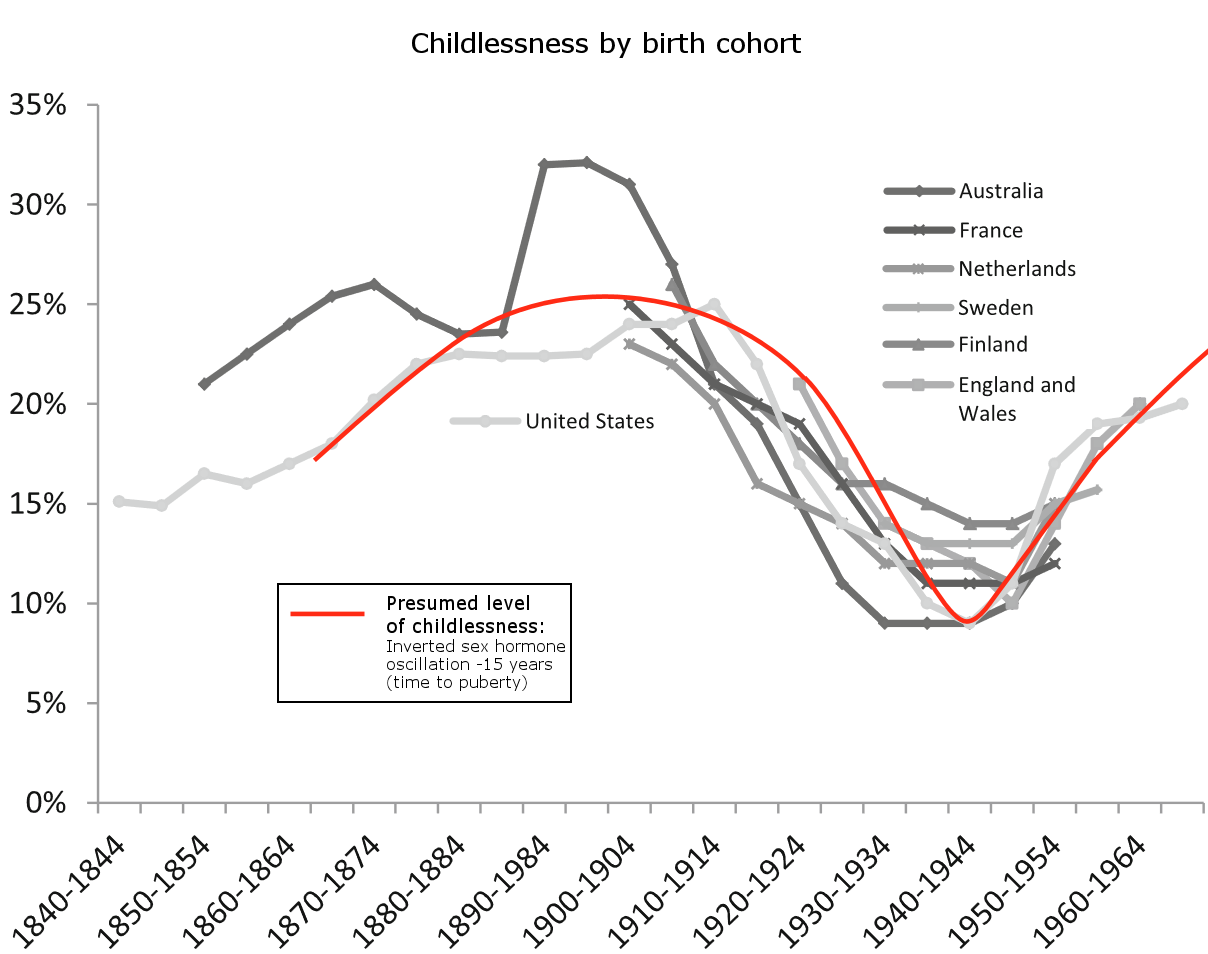
The red line’s relatively close alignment with the childlessness statistic further enforces the premise of the 80y hormone cycle being active among the Western countries.
In addition to infertility rates, when looking at birth cohort fertility rates, there exists a striking synchronicity in timing between the Western countries (statistic below). Although fertility trends in the Western countries have descended for over two centuries in the Western countries, there is a clear deviation from this trend for birth cohorts between 1910~1950.
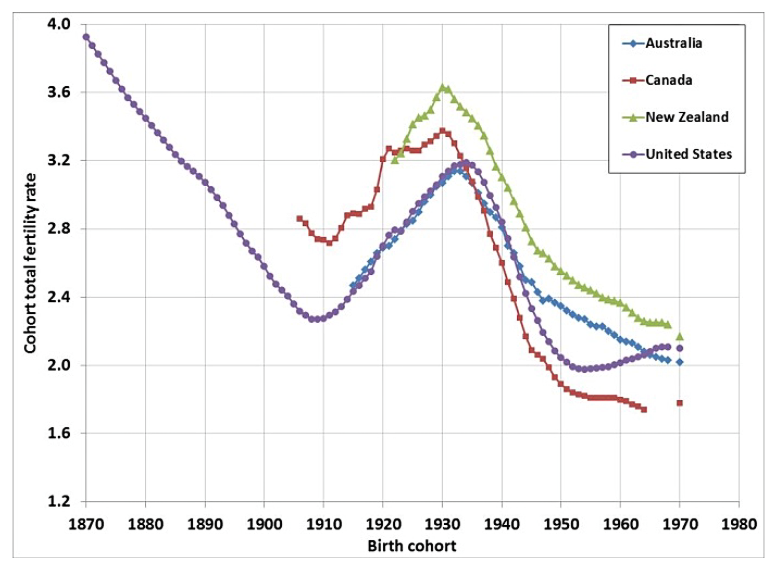
Cohorts between 1910~1950 were in fertile ages when the sex hormone level oscillation peaked in the Western countries between 1950 and 1970, that resulted in the baby boom of the 1950s and 60s (statistic below).
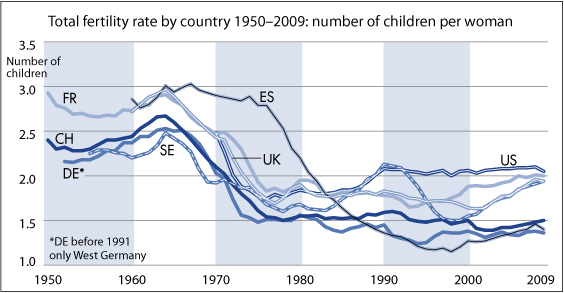
As for the previous century, the changes in fertility rates are less pronounced in the US and the UK, that are presumably the two most likely cyclic countries, but the decades around 1880s are above the trend line in the UK, and in the US, the source statistic does not show much variance in the 19th century. (S)(S) Many Western nations show a similar trend with the UK, as the decades after 1880s are generally decades of steep decline in fertility rates, while the previous decades have been more of a plateau [a rough generalization]. (S)
Presuming the sex hormone oscillation is a relatively accurate, fertility rates will increase and childlessness rates will decrease during the late 2020s, and this trend will continue throughout the 2030s, and peaking close to 2040-45 in the Western countries.
But why are there no clear population cycles found of Western countries like in the cyclic animal populations if they share a similar generational hormone cycle? On average, humans today live to be much older than before (Gurven & Kaplan, 2007152), and if humans still lived shorter lives like human populations who lived in the wild/nature, this would be more easily visible in population numbers. Since most of the Boomers are still alive in 2020, population numbers have not plummeted. In addition, populations of larger mammals exhibit less variation to population size than populations of smaller mammals, which could be due to more overlapping of generations, since larger mammals live longer on average. (Erb et al., 2003153)
As for the societal effects of sex hormone levels, the curve in the graph above is roughly in line with the Strauss-Howe generational theory’s generationally oscillating ‘gender gap’, that reaches its maximum width during a 1st turning, meaning that the gonadotropic cells are presumably more active and secreting more sex hormones during that period of time. Increased levels of sex hormones would explain the sexual revolution of the 1960s, an era when sex hormone levels were presumably high, which would result in more sexual activity in the entire population. (S)(S)(S)
Apart from issues related to sexual behavior and reproduction, low testosterone levels have other significant impacts to male health, including a heightened risk for developing metabolic syndrome, type 2 diabetes, and coronary artery disease. (Goodale et al., 2017154) Low testosterone levels have also been linked to depressive symptoms in men, and according to a meta-analysis, testosterone treatments have resulted in significant reductions in depressive symptoms. (Walther et al., 2019155)
2.3 Generational growth hormone levels
Growth-hormone-releasing hormone, that stimulates growth hormone secretion, is secreted from the hypothalamus, and higher levels of growth hormone secretion leads to larger animals and higher body mass on average. (Furigo et al., 2019156/S) This is why growth hormone levels are presumably highest during the mid-phase of the animal population cycles: “An important biological feature of cyclic populations of voles and lemmings is phase-related changes in average body mass, with adults in high-density phases being 20–30% heavier than those in low-density phases of a cycle. This observation, called the ”Chitty effect”, is considered to be a ubiquitous feature of cyclic populations… The Chitty effect is predicted to be most pronounced at the late increase or peak phase of a population cycle.” (Oli, 199950)
Since most growth occurs during puberty, and on average the final height of humans is reached by the age of 20, birth cohorts born during 1970s and 80s should be tallest, after which the cohorts should be getting shorter.. Statistical evidence is available to support the claim that the birth cohorts in Western countries have in fact grown shorter than the birth cohorts going through puberty during the 1980s and 90s.
For 18 year old men and women in the US, women’s height peaked in 1988 and men’s height peaked in 1996 (NCD-RisC157) The statistic below confirms the tallest birth cohorts: 1970 for women and 1978 for men.
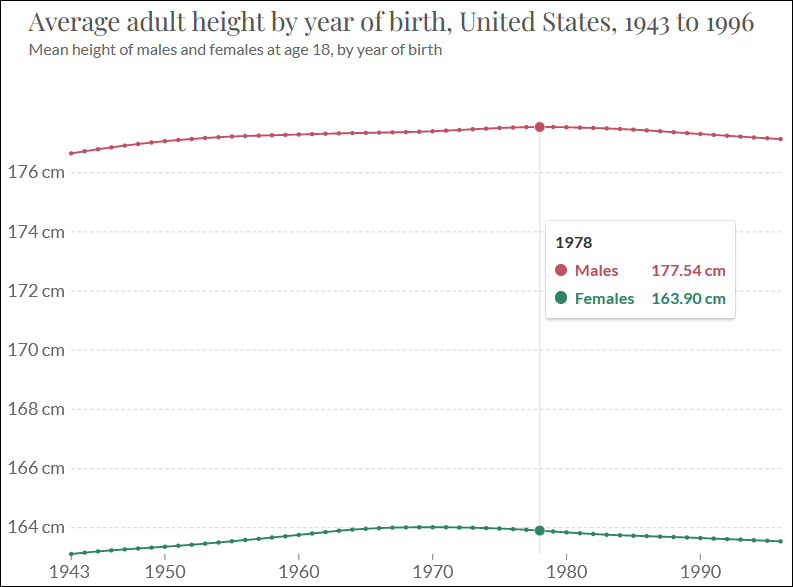
Birth cohort statistics below from the Netherlands and Switzerland show a similar pattern where the cohorts of ~1980 ended up growing the tallest, after which the cohorts have ended up growing shorter. (S)(Vinci et al., 2019158)
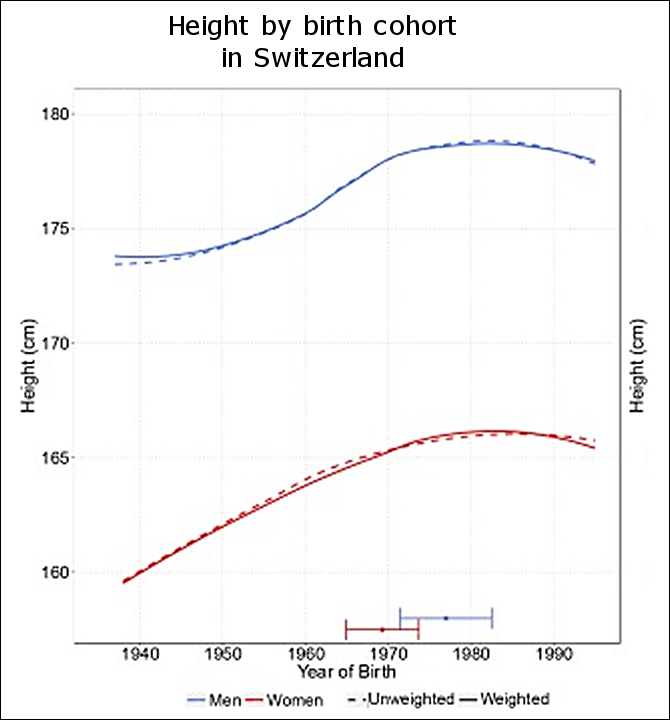
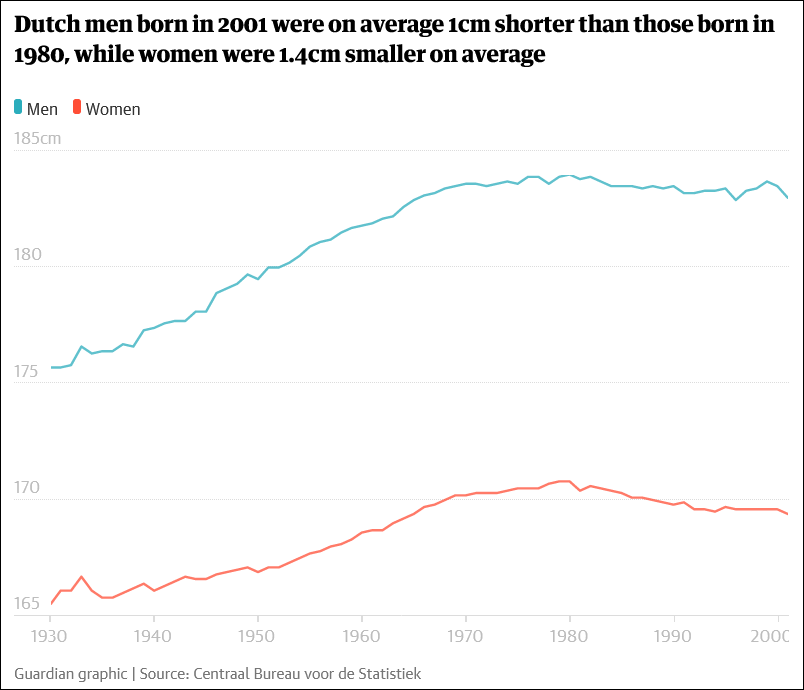
These statistics give more support to the presumption that cohorts from the early 1980s have had the highest levels of growth hormone during their youth.
In addition to physical size, growth hormone levels also modulate behavioral traits. Listed below are a few key behavioral effects commonly found in people with very low levels of growth hormone, which correlates positively with high dopamine levels. (Maric et al., 2010159, Akaltun et al., 2018160)
- Interpersonal sensitivity
- Hostility
- Paranoid ideation
- Anxiety
On average, the Western countries have seen increases to all of the listed behavioral traits, especially towards out-group members: 1 & 2) interpersonal sensitivity and hostility have manifested as increasing confrontational social behavior, 3) paranoia has manifested for example as increasing vaccine hesitancy, fears regarding the 5G technology, and various ideologically driven conspiracy theories, many of which have unified under the Qanon conspiracy theory, and 4) anxiety levels have been high compared to the 1980s and 90s.
High levels of growth hormone can make an individual feel overly confident, and inversely low levels can make an individual feel insecure. The Strauss-Howe generational theory presents that the general views of the future in the US, whether they are overly positive or negative, oscillate throughout the phases of the generational cycle: on average, the most positive views of the future occur at the end of a 2nd turning, and the most pessimistic views of the future occur at the end of a 4th turning. Below is the generational growth hormone curve along with these presented views of the future from the Strauss-Howe generational theory.
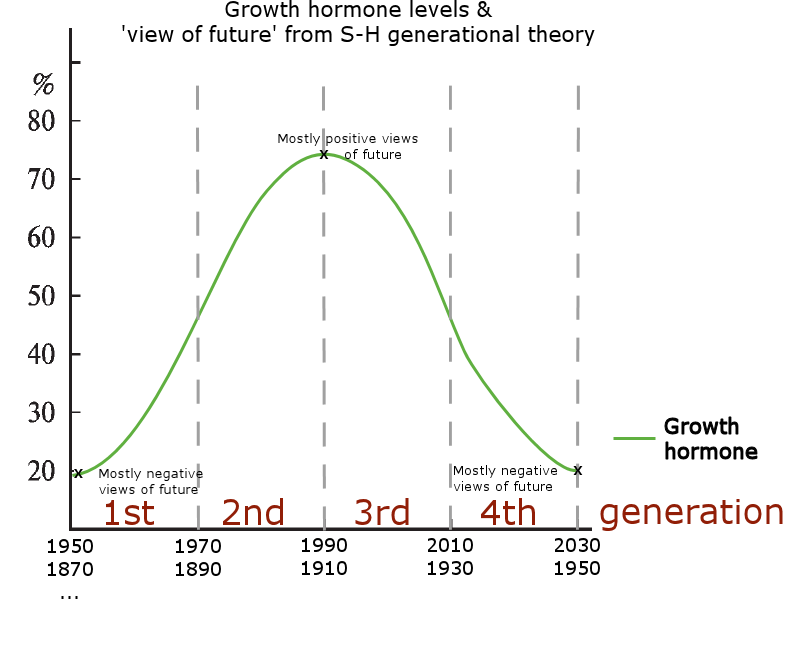
The curve illustrates that the theoretical growth hormone cycle from the animal population cycles and human populations shows not only a correlation between height statistics from the past decades, but also a correlation with the Strauss-Howe generational theory regarding the views of the future. And in cyclic animal populations the behavioral traits are the same: animals are more bold during mid-cycle phases, and more timid at the end (and beginning) of the cycle.
2.4 Generational cortisol levels
In cyclic animal populations, cortisol levels peak at the end of the 3rd phase. Abnormally high glucose levels and high rates of diabetes have been found at this phase of the cycle in a study conducted on cyclic lemming and vole populations. (Niklasson et al., 200660)
Because high cortisol levels cause insulin resistance, statistics of type 2 diabetes incidence reveal if cortisol levels have peaked close to 2010 as indicated by the generational hormone cycle’s model below. (Joseph & Golden, 2016161; Tsalamandris et al., 2019162; Hackett et al., 2016163)
The US statistic for type 2 diabetes incidence (below) correlates very closely with model of the generational hormone cycle, as the year 2009 had the highest incidence rate, after which the incidence rate has decreased by over 30%. (Benoit et al., 2019164)
While the statistic above reaches 2017, the statistic below shows how the incidence has continued to decline from 2017 to 2021.
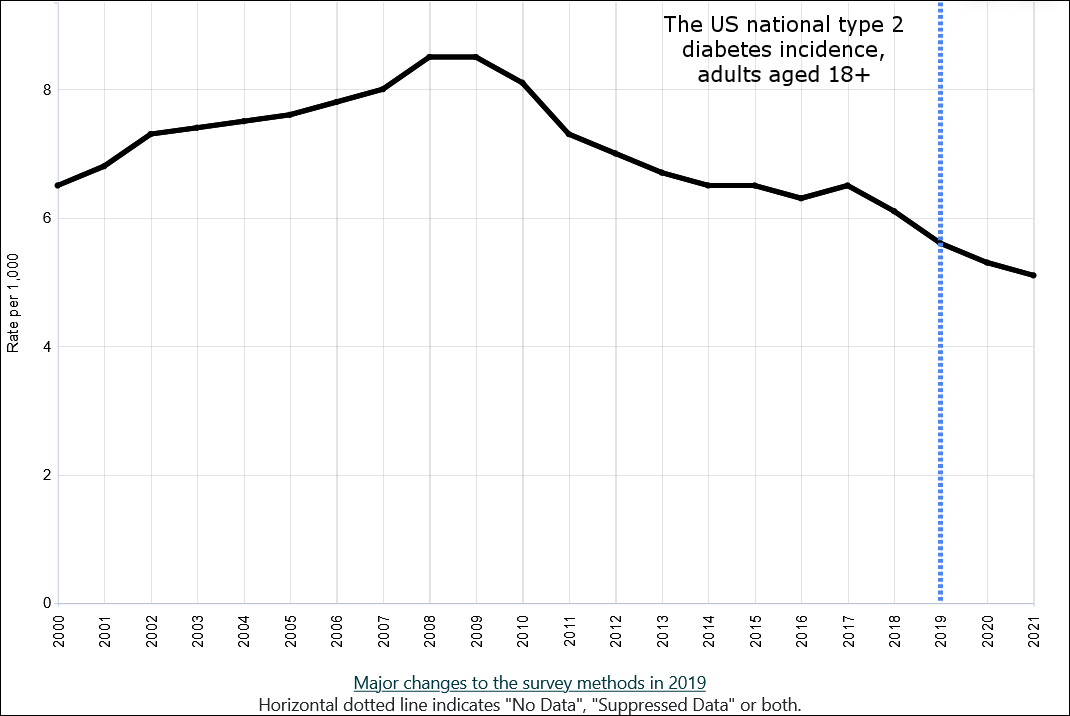
In fact, most Western countries have witnessed similar peaks in incidence occurring close to 2010, including Canada, the UK, Australia, Denmark, Germany and Finland. (Magliano et al., 2021165; Johansson & Norhammar, 2016166; Knudsen et al., 2022167; Tönnies et al., 2023168; S)
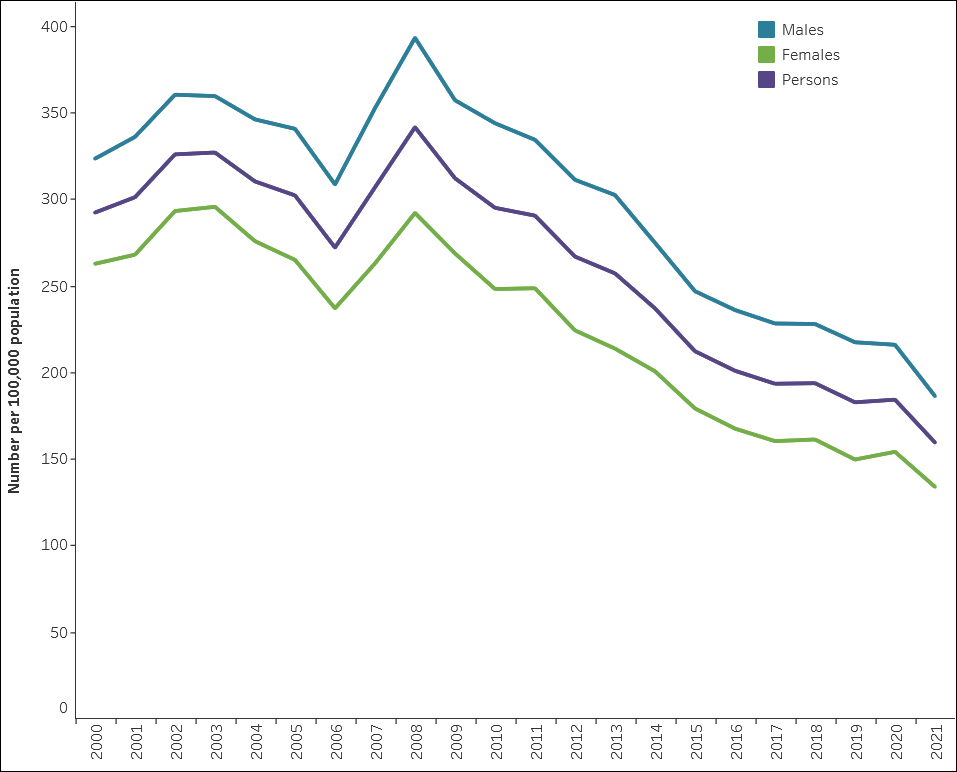


As is with the other statistics presented in chapter 2, the sudden turning of the trend among Western countries has remained as an unexplained phenomenon. The downward turn in the incidence rates of type to 2 diabetes circa 2010 has been perplexing to scientists since a) obesity is the largest single contributing health factor in the development of type 2 diabetes (S), and b) obesity rates increased during the 2010s in the US (CDC), Canada (S), and the UK (S). As an indicator of weigth increases, the statistic below shows how overweightedness percentages have climbed during the past decades.
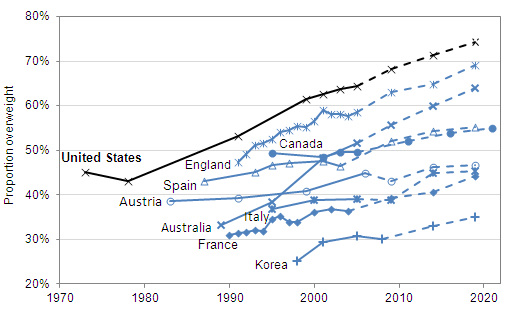
In comparison, countries located below 30 latitude do not show signs of a peak in type 2 diabetes incidence trends around 2010. These countries include Malaysia, Thailand, Singapore and China (even though China’s population, on average, is located close to northern latitude 30). (S)
2.5 Generational oxytocin levels
2.5.1 Parenting intensity & breastfeeding rates
Higher oxytocin levels in parents leads to more time spent with children. (Gordon et al., 2010170) The Strauss-Howe generational theory states the following about child nurture (S) intensity: 1st turning nurture is relaxing, 2nd turning nurture is underprotective, 3rd turning nurture is tightening, and 4th turning nurture is overprotective, after which the next 1st turning child nurture is once again loosening. The graphic below, that is taken from the book Generations (1991), illustrates the 80 year cycle in nurture intensity. The nadir during a 2nd turning is roughly years 1965 to 1985 in the current cycle.
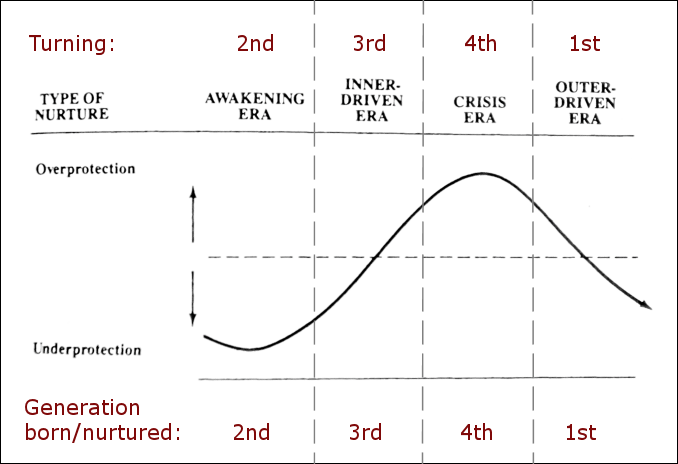
It is generally acknowledged that child nurture in the 1970s was much more carefree on average than in the 2000s (S), and according to the statistic below, it seems that the 1970s were also the time when American parents spent the least time with their children compared to the other decades in the statistic, with the nadir being in 1975 and peak amount of hours occurring some 30y later during the mid-2000s.

The bottom year is close to 1975 and the top year seems to be close to 2005-2010 until the trend begins to go down, repeating the same years as with the breastfeeding rate and paternal age statistics. There is also a steeper climb from 1975 to 1985 like with the breastfeeding rate and maternal/paternal age statistics (reviewed next). Other Western nations also show large increases in parenting time since the 1970s. (Sani & Treas, 2016171) In addition, the statistic shows a pattern very similar to the breastfeeding initiation statistics and maternal & paternal age statistics presented next.
Breastfeeding statistics should correlate with the presumed generational oxytocin levels, as breastfeeding requires oxytocin to enable the milk let-down reflex. (Augustine et al., 2017172)(S)(S) “Circulating oxytocin is critical for normal birth and lactation. Oxytocin is synthesized by hypothalamic supraoptic and paraventricular neurons and is released from the posterior pituitary gland into the circulation… While it might be controversial as to whether oxytocin plays an indispensable role in parturition, the critical role that oxytocin plays in milk let-down during lactation is not disputed. The release of milk is mediated by secretion of oxytocin from the posterior pituitary gland, and oxytocin’s action at OTR [oxytocin receptor] in the mammary gland induces a rise in intra-mammary pressure and release of milk: an oxytocin-mediated reflex upon suckling.” (Scott & Brown, 2013173)
Available breastfeeding statistics from Western countries indicate that there is a low point in breastfeeding rates close to 1965-1975: US (Albanesi & Olivetti, 2009174; Ryan, 1997175)(S), Australia (S), Norway (S), Sweden (S), New Zealand, and England & Wales. Even Japan shows a similar curve. (Inoue et al., 2012176)
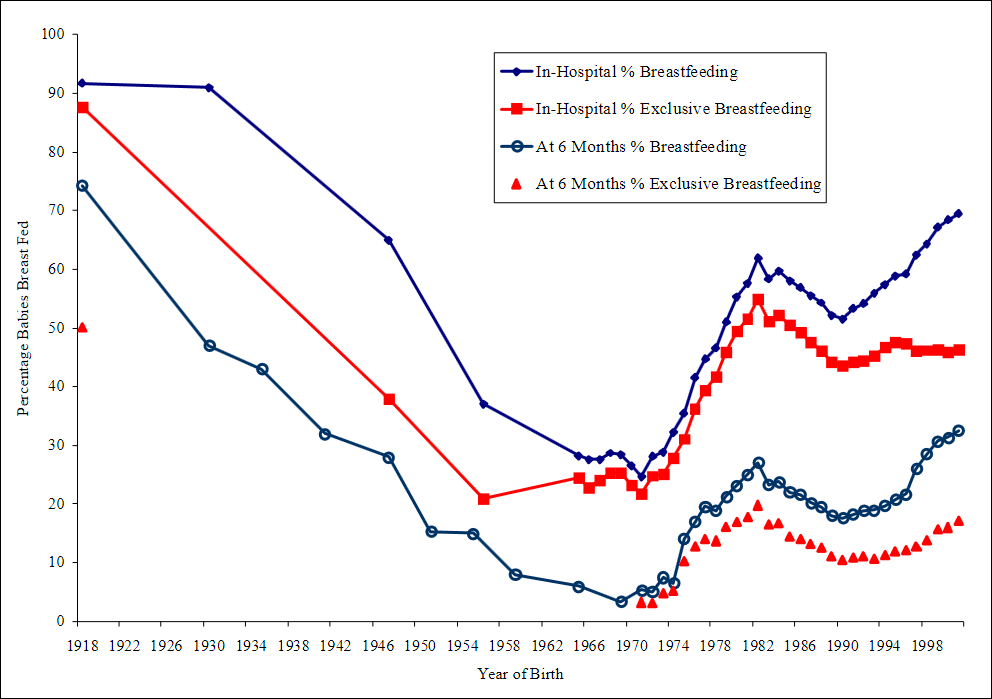
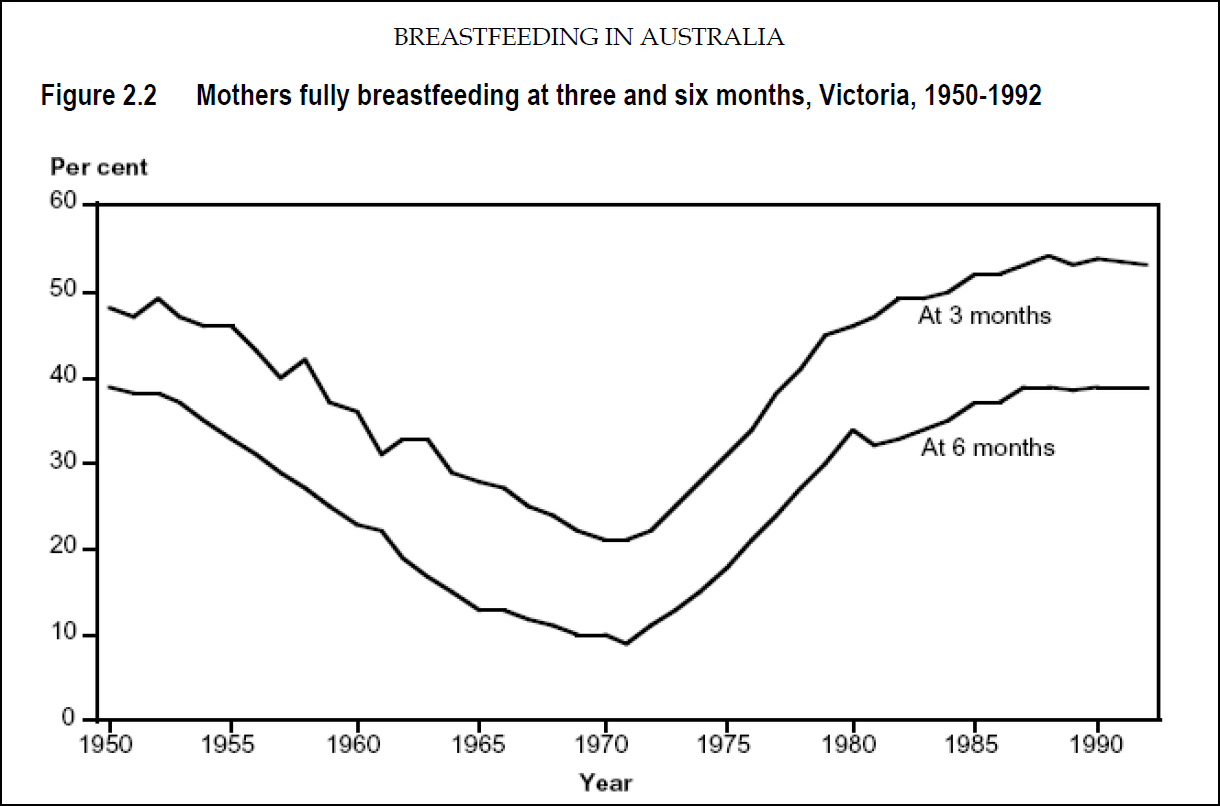


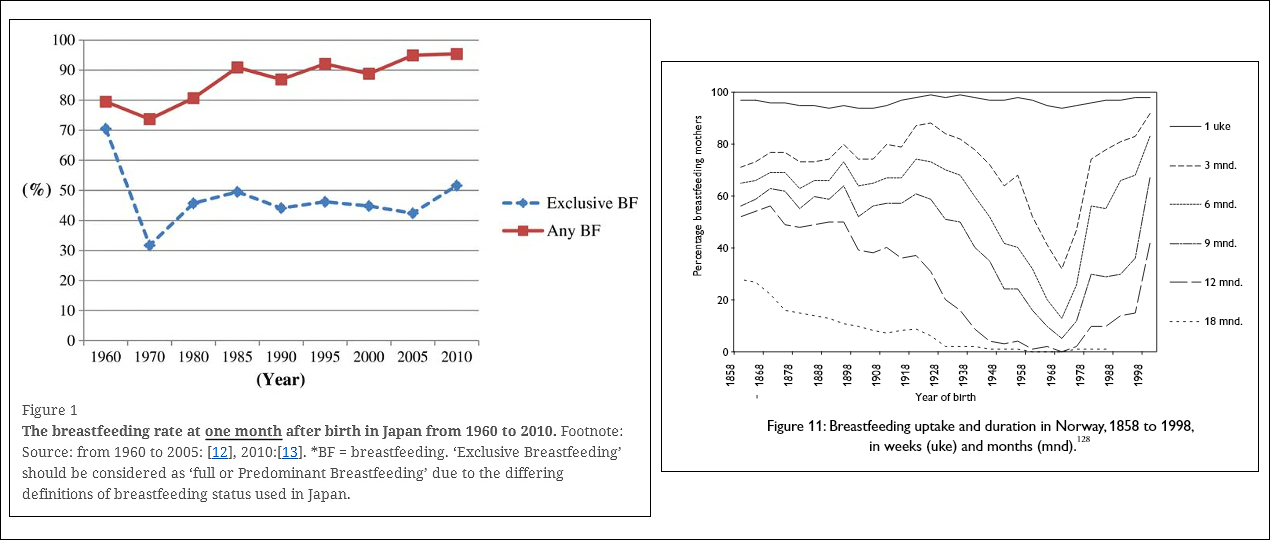

A verbal statement about the US rates reinforces the statistics that the rates were higher in the 1930s than in the 1970s: “Seventy-seven percent of the infants born between 1936 and 1940 were breastfed; the incidence declined during the subsequent decades to about 25% by 1970.” (Institute of Medicine, 1991177)
When looking at earlier centuries for similar patterns of low points in breastfeeding in the US, there unfortunately are no breastfeeding statistics from the 19th century, but here is a quote from the year 1887 that provides answers: “Then, bizarrely, American women ran out of milk. “Every physician is becoming convinced that the number of mothers able to nurse their own children is decreasing.” Another reported that there was “something wrong with the mammary glands of the mothers in this country.”…In the United States, nineteenth- and early-twentieth-century physicians, far from pressing formula on their patients, told women that they ought to breast-feed. Many women, however, refused. They insisted that they lacked for milk, mammals no more.” (S) The inability to breastfeed is a probable indicator of low oxytocin levels, and like the Strauss-Howe generational theory states, nurture intensity was also low during this period.
And from 80 years earlier, this text may provide answers: “As with so many popular trends, there came a backlash against the use of wet nurses. Come the late 1700s/early 1800s—as part of the reform movements that swept across the social landscape of Europe and the United States—many women and men were calling for a return to in-home breastfeeding of babies by their own mothers.” (S) If there were calls to return to breastfeeding, that could indicate that the breastfeeding rates by biological mothers quite possibly have been low during that point in history.
Historical UK breastfeeding rates closely echo the findings from the US. The following quote enforces this presumption: “The interwar [between WW1 and WW2] years saw the start of a long, steady decline in breastfeeding… breastfeeding rates in mothers leaving the postnatal wards dropped to below 20 per cent around 1970… there is no doubt that the 1970s represent a nadir in breastfeeding rates… But, for whatever reason, it is a fact that breastfeeding rates were much lower in the 1970s than in the decades before, and lower than they are now [2007].” (S)
In addition, since oxytocin is also required for parturition, and there is a negative correlation between caesarean section and breastfeeding rates, this enforces the presumption that breastfeeding statistics would correlate with the mother’s oxytocin levels. (Blanks & Thornton, 2003178, Hobbs et al. 2016179, Smith, 2007180)
As for the connection between child the child nurture intensity, Generation X, a 2nd generation, was born during 1965-1983 (estimations slightly differ between Western nations and but also between generational historians) and would, according to the Strauss-Howe generational theory, be a 2nd generation that received underprotective nurture. (S) Parents’ high oxytocin levels lead to more intense nurture, and low oxytocin levels lead to less intense nurture. (Gordon et al., 2010170) Especially the Australian breastfeeding statistics, which are probably more accurate than the US statistic (comprised of three different sources), illustrates that rates are at the lowest point during the birth of Generation X, which correlates with low nurture intensity, and this is presumably due to low societal oxytocin levels. (Gordon et al., 2010170)(S)

The statistical evidence therefore supports the presumption that the Strauss-Howe generational theory’s 80 year nurturing intensity cycle is a generationally oscillating oxytocin cycle with a span of roughly 80 years. Looking forward, breastfeeding rates will presumably stay at high levels for the rest of the 2020s, then begin a decline until the next low point is reached close to the year 2050.
2.5.2 Alcohol consumption
Alcohol consumption statistics should reveal changes in historically varying oxytocin levels because alcohol and oxytocin have similar effects (Mitchell et al., 2015181), and oxytocin has been shown to inhibit the effects of and lessen the cravings for alcohol. (Bowen et al., 2015182; King & Becker, 2019183; King et al., 2021184) If these studies are accurate, then low oxytocin levels could lead to higher alcohol consumption and higher oxytocin levels could lead to lower alcohol consumption in the population. The Fourth Turning book states the following about per capita alcohol consumption rates following the 80 year generational cycle: “They begin rising late in a 1st turning, peak near the end of the 2nd turning, and then begin a decline during the 3rd turning amid growing public disapproval.” The graph below shows that the 3rd turnings in recent centuries (1830-1850 and 1910-1930) indeed saw large sudden decreases in per capita alcohol consumption.
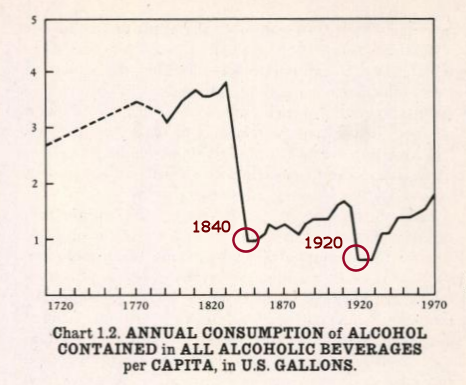
Two more statistics are available from the 19th and 20th century, and both show similar behavior in alcohol consumption: low points of alcohol consumption are in the 1840s and 1920s when compared to the previous decades in the UK (S)(S) and the Netherlands (S).
There was once again a similar drop in the alcohol consumption 80 years after the low point of 1920s, as roughly the year 2000 was a low point in the US alcohol consumption, preceded by a high point in the 1980s. (S) Most Western nations show this same pattern of year 2000s having lower alcohol consumption rates compared to the 1980s. (S) Especially adolescence alcohol consumption has greatly gone down for the last two decades in the Western nations (S)(S)(S), while Boomers’ consumption has gone up in several nations. (S)(S) These statistics are directly in sync with the previously made presumption that the younger generations (Millennials, Gen Z) have higher oxytocin levels than the older generations (Boomers, Gen X) in their youth. But the trend for adolescents should be turning around 2020-2025, and first signs of this are possibly already showing for instance in Sweden. (S)
Dopamine levels should be also taken into account when looking at alcohol consumption rates, and this is reviewed in chapter 2.7.1. It is presumed that low dopamine levels drive up the alcohol consumption, which peaks close to the beginning of the 3rd turning (close to the year 1990 in this cycle), and then starts a sharp decline that ends before the 3rd turning comes to a close
If the generational oxytocin level curve is accurate, oxytocin levels will continue to decrease during the 2020s, leading to decreasing trends in breastfeeding rates and less intensive childcare. Although, oxytocin can be given as a nasal spray at hospitals for mothers that are unable to breastfeed after giving birth, which may skew some statistics from the 21st century. Statistics show that breastfeeding rates in the US, Canada and the UK have started to decrease after mid 2010s. Since sex hormones inhibit oxytocin, the statistics indicate that cohorts between 1985-90 have the lowest sex hormone levels, and therefore the highest oxytocin levels. (S)(S)
In addition to low sex hormones leading to higher maternal age, higher oxytocin levels have also been linked to higher maternal age. (Erickson et al., 2019185) In human studies higher baseline levels of oxytocin has been attributed to higher prevalence of infertility, which further indicates that sex hormones and oxytocin have inverted hormone levels, driven by the sex horme levels. (Lui et al., 2010186)
2.6 Generational dopamine levels
2.6.1 Crime rates
While oxytocin levels modulate social cohesion in the context of family, friends, and other small-scale social connections, dopamine modulates group cohesion in large-scale social networks. (Pearce et al., 2017139) Dopamine modulates an individual’s feelings of being a part of large-scale social networks like a political party, religious group, or a nation. Higher dopamine levels increase these feelings of connectedness.
Low dopamine levels predispose an individual to having learning problems, impulsive and aggressive behavior, and proneness to substance abuse and addiction. (Chester et al., 2015187; Leyton & Vezina, 2014188; Gold et al., 2014189)(S)(S)(S)
It is explained here why individuals who commit (especially violent) crimes have lower levels of dopamine than the population on average and how crime rates indicate oscillating dopamine levels in the US and other Western countries. (Schlüter et al., 2013190) The Strauss-Howe generational theory states that a noticeable increase in crime occurs during 2nd turnings but then drop during 3rd turnings.
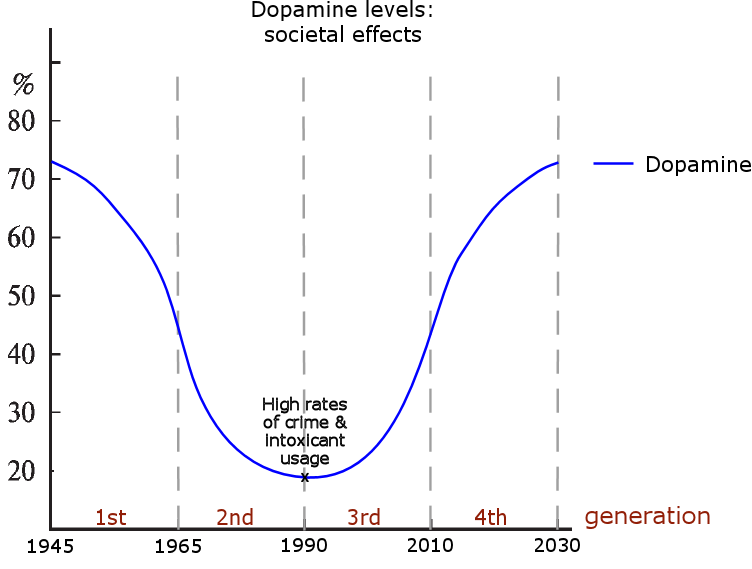
Strauss & Howe correctly predicted the crime peak of the early 1990s in their first book Generations. The violent crime rate statistics from the US, Canada and the UK confirm the accuracy of their prediction.
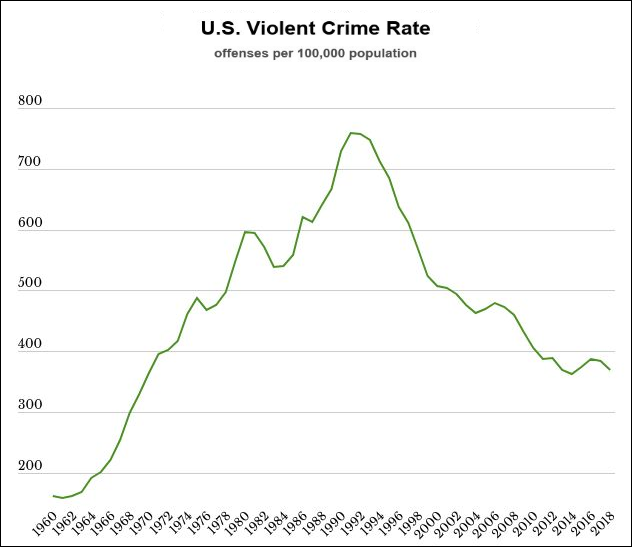
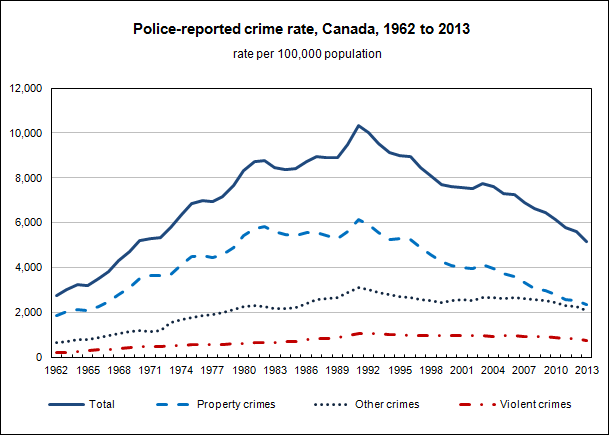
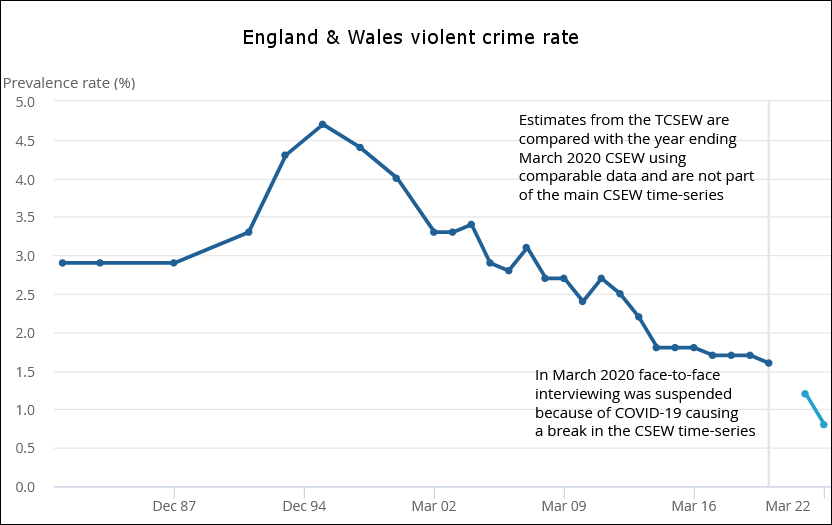
The reason for these significant and largely concurrent shifts in crime rates have remained ‘a mystery’ to researchers. (Tonry, 2014191; Lappi-Seppälä & Lehti, 2014192)(S)(S) No sociological or criminological hypothesis exists that can explain this phenomenon in any of the presented countries or the relative statistical synchrony between countries. (Farrell et al., 2014)
Since most of crime is committed by individuals in their twenties and crime peaked in most Western countries in the early 90s, this would mean that the highest levels of crime are committed by the birth cohorts from the 1960s and 70s, which has been confirmed in a recent study. (Spelman, 2021193)
And similarly to the other proxy statistics presented, Russia lags roughly 15 years behind the US in the crime rate statistics with a clear peak in the mid 2000s. (Chistic, 2019194)
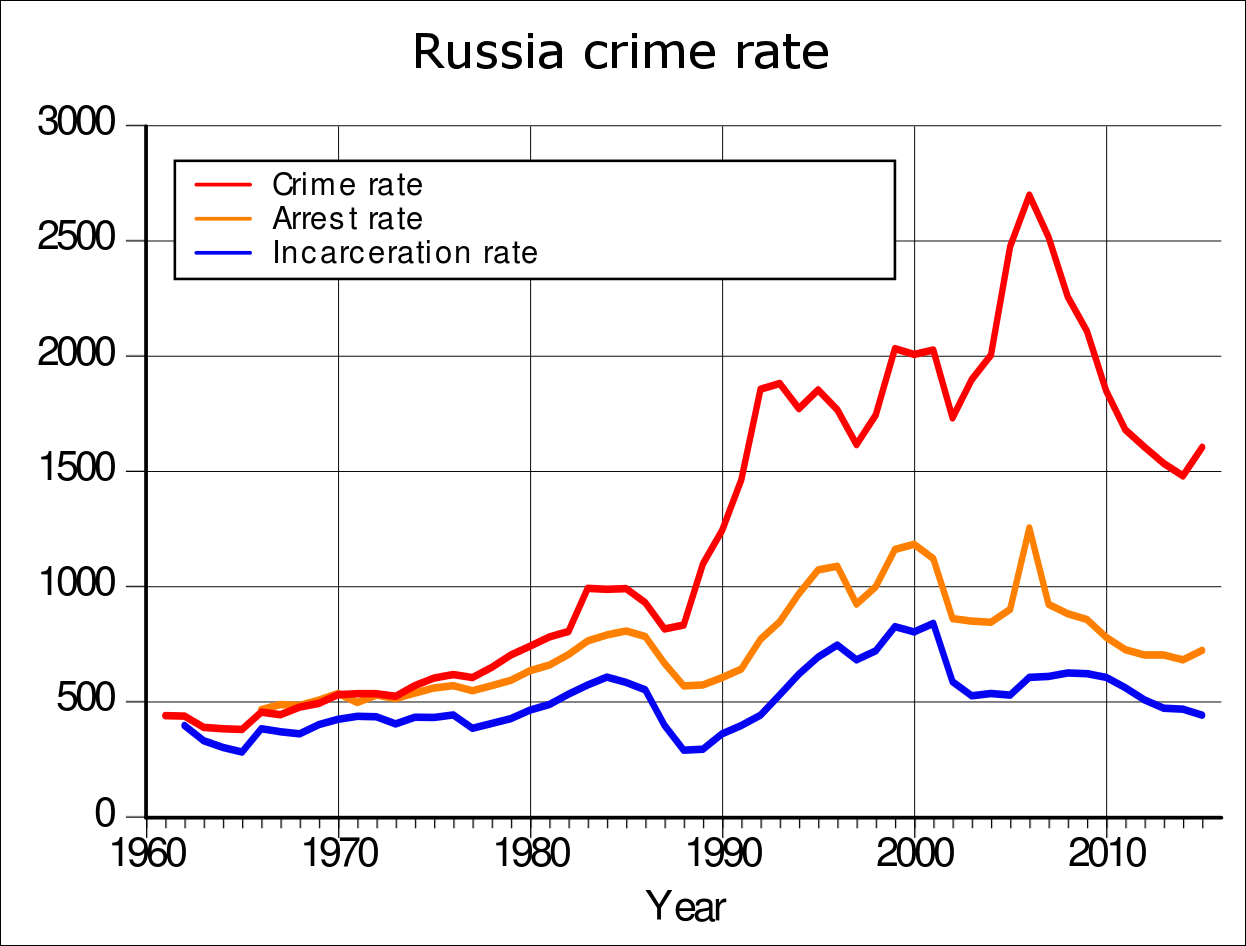
Impulsive behavior is connected to a low resting heart rate (Portnoy et al., 2014195; Baker et al., 2009196), and it is considered to be the best-replicated biological correlate of antisocial behavior. Violent and non-violent criminals have been found to have a lower heart resting rate and lower blood pressure compared to the population as a whole. (Latvala et al., 2015197; Murray et al., 2016198; Culpepper & Froom, 1980199) Furthermore, a birth cohort study has found that a high resting heart rate protects against the intergenerational transmission of antisocial behavior. (Raine et al., 2023200) Because low dopamine levels result in lower resting heart rate and lower blood pressure, the connection between dopamine levels and the tendency to take criminal actions is apparent. (Ziegler et al., 1985201)
The connection between high crime rates and low dopamine levels is also reflected in the annual seasonal changes: 1) crime rates are highest during late summer, which is also when blood pressure levels are at their lowest levels. (Tiihonen et al., 2017202; Fares, 2013203)(S) Dopamine levels have also been directly observed to be lower during the summer, which even further establishes the link between low dopamine levels and high crime rates. (Eisenberg et al., 2010204)
As for dopamine’s effect on alcohol consumption, chapter 2.3.4 already established the fact that the Baby Boomers (a 1st generation) have the highest rates of alcohol consumption among current generations, and, in addition, the statistic below from the UK shows how the birth cohorts from the early 1960s also have the lowest levels of abstinence.
The Strauss-Howe generational theory states that anti-social selfish behavior is common and better tolerated during the 2nd and 3rd turnings, and that such behavior is less common and tolerated during the 4th and 1st turnings, which is in line with the presented hormone levels, since low dopamine levels promote anti-social behavior.
These statistics of mid-cycle aggressive behavior are in line with the observations regarding cyclic animal populations durin mid-cycle: “…animals in high-density phases are much more aggressive than those in low-density phases.” (Oli, 201924; Matthiopoulos et al., 2002206; Piertney et al, 2008207)
2.6.2 Mental health
High dopamine levels can introduce a wide range of adverse mental health effects such as frequent feelings of fear, anxiety and loneliness. (Hamati, 2023208; ) Other symptoms include mood disorders, depression, impulsive behaviour, and social isolation. These symptoms have been increasing in prevalence among the youth in the US and other Western countries since 2010. (CDC; Haidt)
The statistic presented below are from social psychologist Jonathan Haidt’s (S) and psychologist Jean Twenge’s (S) Substack posts. Haidt and Twenge claim that the ongoing youth mental health epidemic is primarily caused by a combination of social media, smartphones and fast internet connections. But this claim does not appear to be correct, as statistics do not show causation or even clear correlation of technology causing the youth mental health epidemic. (Vuorre & Przybylski, 2023209)
Instead of blaming technology for the youth mental health epidemic, the multiannual hormone cycle’s dopamine oscillation provides a coherent explanation for the increases in dopamine-related adverse mental health effects.
According to the model of the multiannual hormone cycle, the dopamine oscillation crossed the ‘average’ line in 2010 in the US. Therefore, a statistical phenomenon of adverse mental health effects should be detectable in the Western countries after 2010 especially among the youth.
Dopamine activates conscious self‐monitoring. (Joensson et al., 2015210) This can lead to self-derogation when coupled with feelings of fear that high dopamine levels also promote. The statistic regarding self-derogation among 12th graders shows a relatively steady trend between 1977 and late 2000s, but the trend took a sudden upward turn close to 2010.
The incidence of major depression episodes has increased after 2010 among US adolescents and adults aged 12-34.
Serotonin is often called “the happiness hormone” because high serotonin levels are associated with a positive mood. Inversely, low serotonin levels are associated with a negative mood. (Mitchell & Phillips, 2007211) Since dopamine is an antagonist for serotonin, i.e. elevated dopamine levels decrease serotonin levels, constantly increasing dopamine levels lead towards a negative mood. The statistic below shows that adolescent pessimism has clearly increased after 2010, which supports the premise of dopamine levels elevating above normal.

After 2010, self-harm has become more common among young girls and women in the US according to statistics of emergy room admissions. The trend has increased especially in age groups of 10-14 years, where the admission rate tripled between 2010 and 2020. Below are statistics from five Western countries. The trend began to increase close to 2010 in all countries.
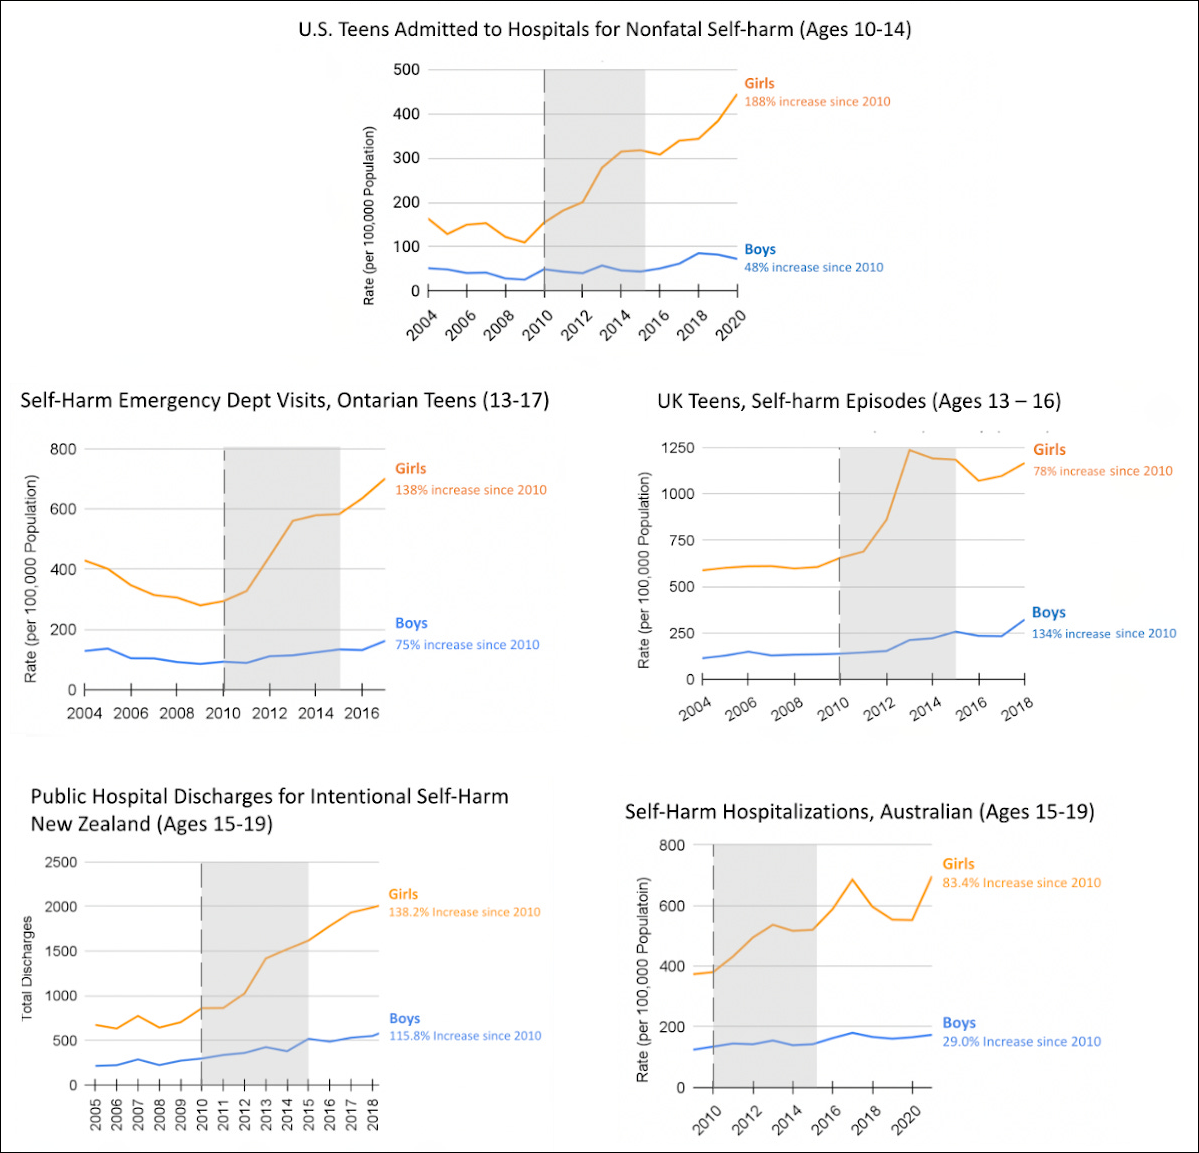
High dopamine levels cause symptoms that are often linked to individuals with ADHD, including restlessness and impatience. These symptoms of high dopamine have been reportedly on the rise during the 2010s and 20s among the youth of the Western countries. [Sources to be added.]
Looking back some 80 years, the 1930s & 40s saw a similar increases in the trend regarding mental health issues in the US. The statistic below shows the number of patients in US mental health institutions (per 100,000 adults).
The trend in mental health institutionalization saw significant increases during the 1930s, then stayed at a high level beween 1940 and 1960, after which it fell to low levels. When applying the statistic to the current cycle, it implies that the current trend of mental health issues will remain at high levels until the year 2040, with the trend peaking close to the year 2030 (as dopamine levels peak).
It should be noted that while the US mental hospital rate has decreased, a significant institutionalization increase has occurred regarding prison rates between 1980 and 2000. Below is the original statistic from which the statistic above has been derived from. It shows how the overall institutionalization rate in the US has increased since the 1970s.
2.6.3 Social dominance and group cohesion
This chapter lays out how dopamine levels modulate social dominance and group cohesion in human populations, and also how multiannually oscillating dopamine levels drive the evolution of societal dynamics during the 80-year cycle.
Placing dopamine at the center of human societal/social evolution is not a novel idea, as it has been suggested before. (Previc, 2009214) A recent study enforces this idea, because what sets humans apart from our closest animal relatives are our abnormally high dopamine levels: “However, in line with another recent study on gene expression, humans had dramatically more dopamine in their striatum than apes… Humans also had less acetylcholine, a neurochemical linked to dominant and territorial behavior, than gorillas or chimpanzees. The combination “is a key difference that sets apart humans from all other species”… Those differences in neurochemistry may have set in motion other evolutionary changes, such as the development of monogamy and language in humans… As human ancestors got better at cooperating, they shared the know-how for making tools and eventually developed language—all in a feedback loop fueled by surging levels of dopamine.” (Raghanti et al., 2018215/S/S)
To compare cyclic human populations to cyclic vole populations: during vole population peak years, that being the 2nd and 3rd phases of a cycle, migration increases, territorial boundaries are reduced, and co-existence with other species of voles increases. (Johnsen et al., 2019216)(Tähkä et al., Endocrine aspects of population regulation in the genus Clethrionymus, Mem. Soc. fauna Flora Fenn., 1984) During the last phase of a vole cycle, group cohesion and territoriality increase and co-existence with other vole species decreases. Similar phase-dependent changes have been observed in other cyclic animal populations as well.
In human populations this kind of behavior would mean that the 2nd and 3rd turnings are more cosmopolitan eras of low nationalism and low group cohesion, which would be roughly the years 1970-2010 in the current cycle. Group cohesion, territoriality, and nationalism have risen in many Western nations during the past 4th turnings (1930-1950, 1850-1870, and 1770-1790), and in 2010-2030 a similar phenomenon is very evidently happening again.
Going further in history, during the 4th turning of 1690-1710 there was a movement towards increased centralized power of kings and the Pope, even though the concept of a nation was not yet largely adopted in Europe. Also the 4th turning years of 1610-1630 were nationalistic and had populistic tendencies. These event are taken into account in the graph below, which represents the presumed dopamine levels affecting group cohesion and territoriality.
To further elaborate the effects of dopamine, the graph below illustrates the effect to group cohesion in a society when the levels of dopamine are either high or low. The circles represent figurative outer limits of social, ideological and cultural norms. The out-groups left outside have historically often been immigrants, Jews, and other cultural and ideological minorities, suspect of ending up as scapegoats for many societal problems when demands for tighter social cohesion increase.

Strauss & Howe write about tightening social (group) cohesion being a part of a 4th turning and that keeping good social relations within one’s existing social circles is important, because those individuals who are shunned outside social circles will end up without much social support as the social cohesion tightens. [More on group cohesion and scapegoating in chapter 3: Chapter 3.4 presents the three basic paths societies usually take during eras of increasing social dominance and group cohesion.]
Examples of increasing group cohesion in civic life during the current 4th turning are the PC culture / cancel culture and MeToo-movement. These movements have been about enforcing tightening unwritten in-group rules, but the new tighter rules have also been enforced through the justice system, which represents the written rules. Together these written and unwritten rules form an in-group’s behavioral and ideological boundaries, and these boundaries are tighter in a 4th turning due to increased group cohesion.
The politically correct culture became mainstream during the early 2000s and has grown stronger ever since, evolving into an ‘outrage culture’, aka. cancel culture). The MeToo-movement was founded in 2006, became mainstream in 2017, and spawned a multitude of other call-out movements aimed at reducing many old behavioral traits that are seen as derogatory toward other in-group members, even though many of these traits were more tolerated during the 2nd and 3rd turnings. The call-out culture has been spreading through the Western countries quickly, and those who have not complied with the new social rules have been shunned out of social groups, just like Strauss & Howe predicted roughly three decades ago.
Another example of tightening in-group cohesion in a society is the destruction of statues that represent figures from the past that, in their time, have had opinions that are no longer tolerated at all, like statesmen who were proponents of slavery. Books and other platforms presenting the opposing side’s ideals may be banned or destroyed. This is the same behavior that is often witnessed after a war has ended: the winners write the history, and the losing side’s institutions are molded to represent the winning side’s ideology, often resulting in the suppression of the culture of the losing side.
2.6.4 Group hormones & political ideology
This chapter presents a connection between political ideology and dopamine / oxytocin levels. This is done by A) collapsing the political spectrum into its basic blocks of left and right, B) explaining how dopamine and oxytocin are linked to the political spectrum, and C) providing scientific evidence plus cohort-specific statistics to strenghten the validity of the claim.
A) The left vs. right political spectrum is highly visible in the US. The democrats and republicans represent the political left vs. right regarding all major societal issues. (S) In order to connect the political spectrum to neurobiology, both ideological extremes have to be simplified to their smallest common denominators.
Political left = higher taxes, more welfare, less individual risk & responsibility = common rights & responsibilities.
Political right = lower taxes, less welfare, more individual risk & responsibility = individual rights & resposibilities.
B) Therefore, it is plausable that higher levels of dopamine and oxytocin promote left-leaning ideological behavior, because higher levels of these group hormones leads to increased prosocial behavior. Inversely, lower levels of dopamine and oxytocin lead to less social behavior and increased self reliance, resulting in an inclination to lean right on the political spectrum.
Even as all humans are capable of empathy, the circle of empathy is different between the left-wing and right-wing voters: left-wing voters tend to have a circle of empathy that usually covers minority groups such as immigrants and the least wealthy, and they’re seen as preferring cosmopolitanism, while in comparison the right-wing voters have a slightly tighter circle of empathy that is usually more centered on those who are the most beneficial to the society and thus may increase the society’s success when competing against other societies, and they usually are more nationalistic than cosmopolitan in their world views.
C) Higher dopamine levels are linked to left-wing ideology, while lower levels are linked to right-wing ideology. “Researchers from the University of California discovered that people who inherit particularly active dopamine receptor genes are more likely to subscribe to a liberal ideology… Not surprisingly, genes that code for a less active dopamine system have been linked to people who identify as conservative politically….” (S)(Settle et al., 2010217; Ebstein et al., 2015218)
An important indicator of political ideology being linked to biological properties is the fact that the left vs. right ideological spectrum is universal, similar to e.g. height, weight, and blood pressure, as it forms a bell-shaped curve of normal distribution in a country like the other mentioned physical properties. (Cochrane C., Left and Right, McGill-Queen’s University Press, 2015219)
A clear connection between oxytocin and ideological behavior seems to be that oxytocin increases openness to experiences in individuals (Cardoso et al., 2011220)(Pearce et al., 2019221), and simultaneously openness to experience has been found the be the most consistent indicator of ideology: “Our findings show that, in line with the congruency model of personality, Openness to Experience is the best and most consistent correlate of political ideology, with politicians high on Openness to Experience being more likely to be found among the more progressive left-wing political parties.” (Joly et al., 2018222) This indicates that higher oxytocin levels may lead to a tendency towards a left-wing ideology.
Another connection between oxytocin and political ideology is that oxytocin increases gaze cues (for emotional faces) (Tollenaar et al., 2013223), and since individuals leaning left have been found to follow gaze cues more than individuals leaning right (Dodd et al., 2010224/S), this adds to the evidence of high oxytocin levels being possibly connected to a left-wing ideology. Furthermore, a study found that testosterone administration induce a “red shift” in weakly affiliated Democrats, which is expected, since testosterone is an antagonist for oxytocin: administrating testosterone lowers oxytocin levels. (Zak, 2021; Insel at al., 1993225)
The dopamine receptor system has been found to affect political preferences (through the receptor alleles), and twin studies show genetics affect voting behavior, which enforce the premise that dopamine levels also modulate ideological preferences. (Hatemi et al., 2014226; Settle et al., 2010217)
Political ideology has been found to form largely between ages 10 and 30, after which the effects become smaller. (S)
Since the formation of political ideology continues to a lesser extent during adulthood, roughly the age of 25 years is the average age of ideological preferences solidifying inside a birth cohort. Therefore birth cohorts aged ~25 in 1991 when dopamine hit nadir should lean right on the political spectrum.
Placing a divider so 50% of the cohorts with low or high levels of dopamine and oxytocin are on both sides produces the chart below. The birth cohorts presumably leaning right leaning were born approximately 1930-1970, but there should be a small trend towards left leaning ideology for cohorts born close to 1955.

As examples of presumably mostly right-leaning cohorts, the cohorts born close to 1945 experience low oxytocin levels during their most formative years considering ideology, and the cohorts born close to 1965 experience low dopamine levels during their most formative years considering ideology.
By adding a marker (blocks) to whenever either the oxytocin or the dopamine oscillation is at its lowest value produces the graph below.
The birth cohort voting preference curve (above) shares a strikingly high level of similarity with the curve of US voting trend by birth cohort (below).
These voting statistics are very much in line with the presumption that generations born roughly from 1930 to 1970 tend to vote right, with a small leftist peak close to 1950, and the highest leftist peak is close to 1990 in both graphs. This implies that political ideology is modulated by cohort-specific hormone levels. The statistic above also implies that dopamine levels have a stronger effect on the cohort’s political ideology than oxytocin levels.
In addition to birth cohorts displaying ideological preferences, a well established factor regarding the left vs. right political spectrum is the “urban vs. rural” divide, since generally urban voters lean left and rural voters lean right. (S)(S)(S)
This global phenomenon implies that left wing political affiliation is connected to preferring a denser habitat (due to higher dopamine levels), while the right wing political affiliation is linked to preferring having more space (due to lower dopamine levels). (Gimpel et al., 2020227)
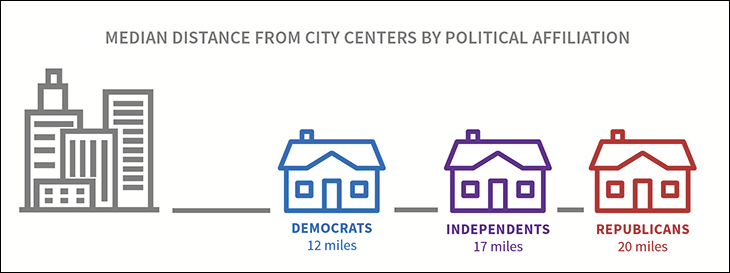
In addition to dopamine, the possibility of the urban/rural divide being linked to oxytocin implicates that breastfeeding rates should be lower in rural areas, which is indeed confirmed by studies. (S)(S)
But is it possible the endocrine system directly modulate ideological preferences? The following study implicates that this is entirely possible.
“These findings, together with the relationship between variations in common polymorphisms of the OXT receptor gene and antisocial behavior, and high callous-unemotional traits, all point to an involvement of the OXT system in upstream attitudinal representations… OXT also influences, and interacts with, representations of attitudes and values in more recently developed cortical regions…” (Hurlemann et al., 2017228)
What is important to note is that the study’s result “…corroborates the hypothesis of abnormalities in the oxytocin system as a core element of developmental pathways to callous-unemotional traits”, which are detectable by a persistent pattern of behavior that reflects a disregard for others, and also a lack of empathy and generally deficient affect. (S) These characterizations best fit the 1st and 2nd generations in the Strauss-Howe generational theory, and these generations (Boomers and Gen X) clearly lean ideologically right.
It should be noted that individual voting behavior is obviously affected by a myriad of different factors, e.g. who is leading in the polls (S), what images are seen shortly before the voting, etc. (S) And like in all decision making, cognitive biases come into play. (S) Things like the ideological affiliations of college friends can also have an effect on voting behavior, but the effect is quite small, possibly due to the brain being already quite mature in young adulthood. (S) But such events are not statistically significant when looking at population-wide voting results over a period of several decades.
According to a recent study, voting is much less rational and more based on emotions than what has been previously thought to be the case. (Taber & Lodge, 2016229) As a general notion of dopamine affecting an individual’s trust towards ingroups and outgroups, the quote below explains how high dopamine levels increase error correction (i.e. distrust) towards outgroup messaging and simultanously lowers error correction towards ingroup messaging.
The fact – well known to political consultants – that people tend to go along with the crowd can be explained by a brain mechanism which has helped our survival as a species. Every time we differ from others, our brain responds by triggering an ‘error signal’, causing us to change our opinion in favour of the majority, reveals a study by Vasily Klucharev
Our Neurons Prompt Us to Join the Crowd
Klucharev’s central hypothesis is that people have a built-in sense of being similar to others. When we differ from the crowd our brain triggers an error signal as if saying, ‘You are wrong; change your mind immediately!’ This signal is generated by the dopamine system linked to a number of areas in the brain, including the prefrontal cortex. This system mediates the release of dopamine, a neurotransmitter involved in triggering error signals every time our judgment is different from that of the crowd.
Magnetic Stimulation Creates Heroes
‘We used a procedure known as transcranial magnetic stimulation (TMS) on the medial-prefrontal cortex involved in the regulation of the dopamine response,’ Klucharev explained. It made the subjects 40% less susceptible to changing their opinions to conform to the group’s, without any discomfort.
An opposite experiment was conducted in Denmark to see whether the desire to conform may be influenced by giving volunteers a pill that increases the amount of dopamine in the brain. And indeed, subjects were observed to change their minds more readily to match the majority opinion. These results demonstrate how much we are affected by our dopamine response every time we differ from the crowd.
Uniqueness as a Deviation from the Norm
Knowing that the choice to follow the crowd is determined by physiology is extremely important, Klucharev believes. ‘We need to understand how easily we can be manipulated because of the way our brain has been shaped by evolution,’ he explains. In most cases, he argues, we are not even aware of the majority’s influence on our behavior. ‘Our internal self-assessment system always compares us to others. We keep checking our behaviour against that of others, expecting to be like them.’ Otherwise, our brain triggers a learning signal by creating discomfort.
…How a Minority Becomes a Majority
Brain dopamine levels differ among people and may determine an individual need to conform. However, the dopamine-mediated error signal may also be determined by other factors, such as the strength and nature of the group perceived to be the majority. If the group is one you like and wish to be a part of, you are more likely to conform. The opposite is also true, as was shown by U.S.-based research. The dopamine-mediated error signal occurred more often when a subject’s opinion differed from that of a group they liked, and was absent when the subject disliked the group.
Marina Selina, August 05, 2013 (S)
2.6.5 The familiar rise of anti-Semitism
It is a well-known historical fact that anti-Semitism peaked during the 1930s and 40s in North America and Europe. Today, some 80 years later, a highly similar trend has manifested again. The 2010s and 20s have seen an increasing trend in antisemitic incidents in the US (S), Canada (S), the UK (S), and the EU on average (S). It is important to note that the trend began before the 2023~24 Middle East conflict involving Israel and Ghaza.
The explanation for these increases in anti-Semitism is explained by the dopamine oscillation that began affecting this trend after it crossed the ‘average’ line in ~2010. This is due to dopamine modulating feelings of social dominance: Jewish communities are commonly perceived as out-groups that have garnered higher-than-average economic and societal power, making them appear to some as both A) being ‘the others’ and also B) being ‘the elites’ that are above ‘the people’. This combination is why anti-Semitism is so strong today, just as it was 80y ago.
To better understand how dopamine affects anti-Semitic feelings, it is important to note the distinction between left-wing and right-wing anti-Semitism. Right-wing anti-Semitism can be characterized as including more fear and paranoia towards the Jews as ‘the others’, whereas left-wing anti-Semitism is more about the hate towards the perceived societal dominance over other groups the Jews are accused of wielding.
Chapter 3: Hormones and group behavior
3.1 Societal trends
This chapter further presents how the generationally oscillating hormone levels can have population-wide effects in human societies to both individual and group behavior, and also the formation of institutions. (Stanley & Adolphs, 2013230)
When looking at the current political and ideological trends, it is clear that populist nationalism and xenophobia have been on the rise in the Western countries for the past decade. Cultural globalism and multilateralism are increasingly rejected by many political parties, especially among the right-wing parties. (S)
Ideological polarization has been increasing and centrist parties have been losing support. (Zur, 2019231)(S)(S)(S) Increasing social divisions based on ideological identity can be clearly seen in basically all Western countries today, as two or more sides are separating from each other and creating ideological rifts. (S)(S) [2022/24 update: Russia attacking Ukraine has predictably decreased the ideological rifts between most Western countries, although, as the war drags on and requires continous resource investments, sentiments against defending Ukraine may diminish among some Western parties going forward. Internal link to updates on recent developments.]
The growing ideological rift between the left and the right has been especially evident in the US.
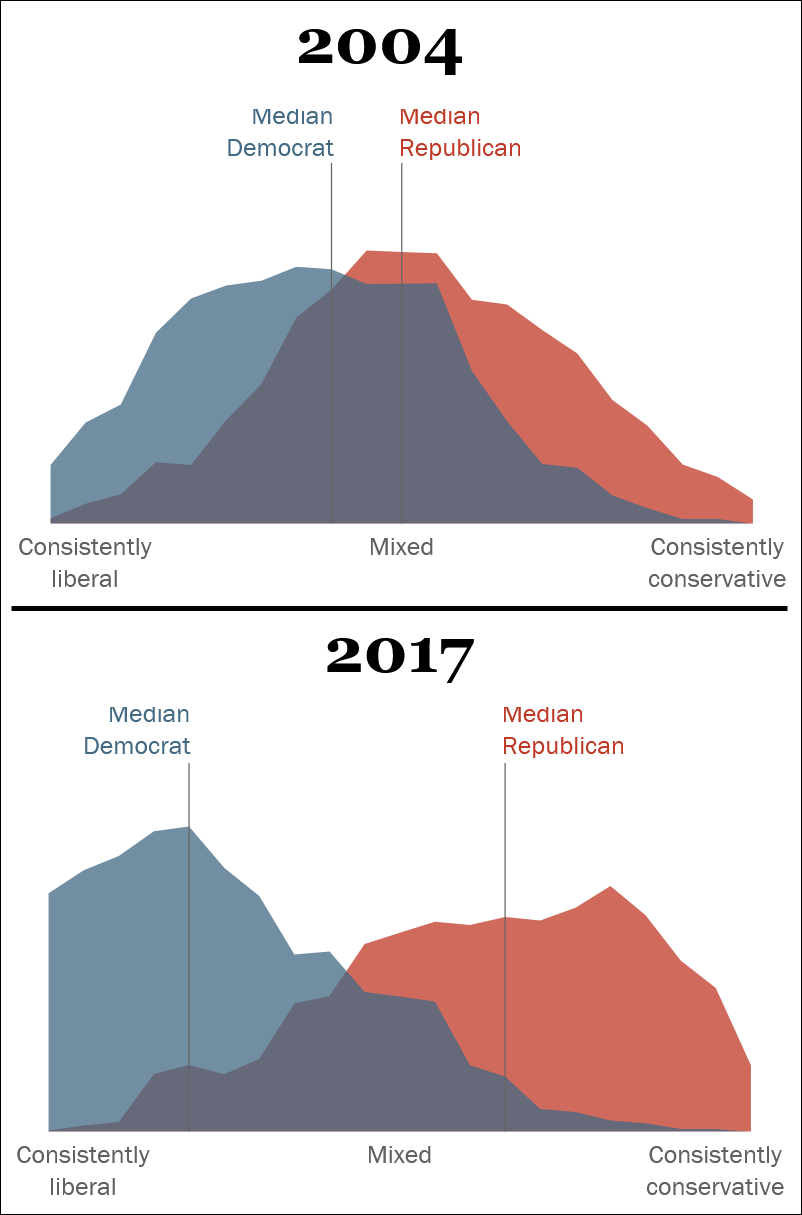
Hate crimes against minorities have become more common (S)(S), including anti-Semitism. (S)(S)(S) Many scholars have compared the 2010s to the 1930s, since many of the same societal effects can be observed to have become more prevalent during those decades that are 80 years apart.
Continuing listing the current societal trends: the status quo of global(istic) politics is being challenged at an accelerating pace (S), press freedom is increasingly being restricted by state actors (S)(S), free speech is being restricted by non-state actors (S), and religious freedoms are increasingly suppressed. (S) News outlets are increasingly ideologically divided (S), fake news are more frequent, and lying on behalf of one’s own ideological beliefs (S) is becoming more common. Not even the scientific community is safe from the effects of the so called post-truth era. (S)(S)(S)
Most studies and pundits explain the movement towards populist nationalism, and more generally the polarization of opinions in political and civic life, by explaining that they happen because of different societal phenomena like mass immigration, economic inequality and social media platforms that are polarizing opinions by forming echo chambers and allowing the distribution of fake news. (S)(S) These phenomena are assumed to create anxieties for the voters of populist nationalists. But none of the explanations or explanatory models built on these observations can predict or explain the rise of populist nationalism or the other mentioned phenomena with satisfactory accuracy, and the accuracy gets even worse when trying to apply these explanatory models to several or all of the Western countries, or to similar societal situations throughout the history.
Tendencies towards populist nationalism are growing basically in every democratic country in Europe, and this movement started well before any big immigration or economic crisis of the 2010s. Nationalism grew as the economic situation in Europe was good and it has kept rising through the worse economic times. Financial crises do raise populist support for a while, but in a historical perspective populist support has generally leveled out in about 4 years after a crisis. (S) It is the same thing with immigration crises: the pace of the rise of nationalism and support for populist parties has not changed much through the years, not on the far-right or the far-left end. Nationalism and populism are not the same thing, but nationalistic parties are more often populist than not, especially on the far-right of the political spectrum.

The overall increasing support for populist nationalism in Europe has been very clear and steady over the past 20 years. The incremental maps below from 1998 to 2018 illustrate how each European country has followed its path to the current situation of higher than average support for populist parties.
The statistic below also illustrates how the 1980s and 90s were decades of low support on average for populist parties.
According to Gini statistics below, economic inequality cannot explain the rise of nationalism and populism, as income inequality has not changed much in the EU, and has actually gone down for most countries during the last 20 years. In the US income inequality has risen, but attempts to raise taxes on the top earners or otherwise level out economic inequality have been pretty rare even on the left, highlights being the candidacy of Bernie Sanders and movements against the big banks (and neither can be said to be very much associated with populist nationalism).
Gini is not the only indicator that should be looked at, as low interest rates and quantitative easing by the worlds central banks have had a lifting effect on rent prices in Europe and the US, which has affected mostly low-income workers and may contribute to the dissent against the so called “elites”. But still, the economic conditions and employment numbers have generally gotten better during the last five years, and yet populism has increased at the same time. (S) Poland is a prime example of a country that has had record economic success during recent years, but in spite of this, populist nationalism and xenophobia have risen sharply:
“This is not 1937. Nevertheless, a parallel transformation is taking place in my own time, in the Europe that I inhabit and in Poland, a country whose citizenship I have acquired. And it is taking place without the excuse of an economic crisis of the kind Europe suffered in the 1930s. Poland’s economy has been the most consistently successful in Europe over the past quarter century. Even after the global financial collapse in 2008, the country saw no recession. What’s more, the refugee wave that has hit other European countries has not been felt here at all. There are no migrant camps, and there is no Islamist terrorism, or terrorism of any kind.” (S) But if Poland was undergoing an economic depression today, the situation would very likely be used as an explanation for the current increases in nationalism and xenophobia. Outside of Europe, Australia is not much different from Poland, as their uninterrupted economic boom has been going on for almost three decades, and nationalism is still on the rise like it is in Europe and the US. (S)(S)
Social media platforms on the other hand seem to accelerate the divisions between individuals with diverging ideological stances: “Social media use tends to diversify communication within social networks by making people aware of what others think and feel about political and social issues. Social media enhance the perception of difference, and interpersonal contacts in these environments are typically rated less positively than interpersonal contacts in face-to-face communication.” (S) Moral-emotional posts tend to spread more effectively on social media platforms (S), and the platforms do play a role in the increasing polarization, but mainly as a catalyst: “Despite these limitations, this study has provided evidence that social media contribute to the growth of negative affect in political communication. Moreover, this negative affect is related to the comparatively high degree of perceived political disagreement that people encounter in social media settings. Thus, to a certain extent, perceived disagreement in social media settings has its roots in affective communication processes.” (S) So if social media is mainly intensifying the current societal trends, whatever they may be at a certain point in time, what could be the root cause for the increases in populist nationalism among Western nations?
The generational hormone theory presented here suggests that the studies and pundits blaming the economic disparities, immigration, social media, and other “usual suspects” for the rise of populist nationalism are probably correct in their observations of these phenomena occurring at the same time or before the rise of populist nationalism, but at the same time are fundamentally incorrect in how much these societal phenomena affect societal change and the general social mood, and thus cannot build working models to explain the rise of populist nationalism in detail. This is because these mentioned societal phenomena are expected to mainly work as catalysts for a generations long trend, a generational cycle of dopamine levels to be more precise, which is modulating the rise (and fall) of nationalism in Western nations at intervals of roughly 80 years.
It is suggested that these catalytic events essentially hide a significant reason for the rise of xenophobia and populist nationalism, just like the Great Depression of 1930s has often been claimed to be the main reason for the rise of nationalism and anti-Semitism in pre-WW2 Germany and elsewhere. (S) The goal is to demonstrate that generationally varying levels of dopamine largely modulate the historical increases and decreases of societal phenomena like populist nationalism and xenophobia by oscillating group cohesion levels of cyclical societies.
3.2 Societal group behavior
The goal of chapter 3 is to point out that many of the current societal trends presented in the previous chapter, especially the rise of populist nationalism and its related phenomena, are presumably created by a combination of high levels of dopamine in human populations, and how stress hormones oxytocin (primary female stress hormone) and vasopressin (primary male stress hormone) increase the inter-group divisions. Even though the human endocrine system and its effects on behavior are still not fully understood, the suggestions made here are aimed at building a bridge between hormonal activity and societal phenomena based on latest research.
As a broad generalization of human social behavior, humans are highly social animals that live and act in groups. (Young, 2008232)(S) Humans have created extensive tools to enhance communication, science, and culture, but these are basically extensions of animal behavior, since other species too can communicate and learn new languages and dialects, build tools and do math, and pass on their culture to their offspring. (Whitehead et al., 2019233) And similarly to humans, animals have been found to have the “more complex” feelings that humans have, e.g. empathy, altruism, grief, contempt, and jealousy. Hormone levels modulate these feelings in humans and other animal species, thus modulating group behavior in human and other animal species.
The standard viewpoints to history concentrates on the societal events and actions taken by individuals, but the generational hormone theory adds a layer of internal biological responsiveness in the form of (presumed) generational hormone levels. Hormone levels modulate individual and group behavior, and also group formation and group cohesion; the larger the hypothalamic neurons that secrete hormones are, the stronger the (hormone specific) reaction to others and the environment is.
Human behavior essentially consist of internal stimuli and responses to other individuals / groups and other external stimuli. Hormone levels modulate all of these of these internal interactions because they modulate the full range of emotions – including the developmental processes leading to these emotions.
History will thus be mainly viewed here as group behavior, further divided into in-group and out-group behavior. Typical in-groups are family, friends, gender, nation, culture, ethnicity, religion, political ideology, etc. Out-groups are basically comprised of people belonging to other in-groups than one’s own in-groups. Dopamine modulates large-scale social network group cohesion, whereas oxytocin modulates social cohesion in the context of family, friends, and other small-scale social connections. (Pearce et al., 2017139)
Viewing history as group behavior is a divergence from the more traditional setting of mainly analyzing individual leaders and their associates, and how their actions and reactions have impacted history. The intent is not to disregard historical individuals who, for example, want to advance their own cause and rise to power by using populist messaging, but instead explain when and why individuals are open, or possibly even inclined, to receive populist messaging. This kind of approach largely negates the belief held in sociology that the rise of populism and nationalism happen (virtually) solely due to societal issues.
Although populist nationalism has had various ways of manifesting, as structures of countries and also types of available ideologies have varied through the centuries, the manifestations of populist nationalism share many easily detectable similarities across millennia, which strongly indicates that the phenomenon has its roots directly in biology.
3.3 Hormones & populist nationalism
Below is a short list of expected changes in individual and group behavior when dopamine levels increase.
1. More nationalism, xenophobia and demands for in-group cohesion.
2. Negative emotions towards in-group non-cooperators.
3. Perceptions of trust and fairness are altered as group-serving lying is promoted.
4. Infra-humanization of out-groups and willingness to fight out-groups.
Points 1 and 2 are often a big part of populist ideology, point 3 explains the post-truth (aka. fake news) era. Points 1-3 of these group behavior changes have been on the rise for the last 20 years or so in the Western nations when compared to the 1990s. The number of hate groups has also increased in the US and the EU. (S)(S)
Oxytocin is women’s main stress hormone, while oxytocin in men’s main stress hormone. While oxytocin does increase empathy (Geng et al., 2018234), the separation between in-groups and out-groups increases at the same time, and this combination can lead to a “wrong kind” of empathy, as the rising feelings of empathy is directed towards the in-group, and coupled with vasopressin this empathy can even lead to aggressive behavior towards in-group non-cooperators and out-groups, especially if the in-group target of an aggressor is perceived to be under stress. (Buffone & Poulin, 2014235) Advocates for populist nationalism use the feelings of empathy constantly to their advantage in their messaging by pitting the in-group against out-groups, and by including possible threats from out-groups to their messaging they can increase their supporter’s stress levels and the secretion of stress hormones oxytocin and vasopressin.
Since higher levels of oxytocin and vasopressin increase anxiety towards unpredictable threats (Grillon et al., 2013236; Kawada et al., 2019237), populist nationalist leaders can gain support by 1) messaging about perceived out-group threats towards the in-group and then 2) presenting solutions on how to address the threats posed by out-groups and keep the in-group safe. Such anxieties are created through emotions – especially fear:
“Populism peddles a politics of fear—of crime, terrorism, unemployment, economic decline, the loss of national values and tradition—and asserts that other parties are leading their countries to disaster. Surveys make clear that populist voters are extremely pessimistic: they believe the past was better than the present and are extremely anxious about the future. But pessimism has infected Western societies more generally. A recent PEW survey for example revealed that even though growing percentages of European citizens view their country’s economic situation as dramatically better than a decade ago, this has not translated into greater optimism about the future. Indeed, in many European countries the “experience-expectation” differential has grown: in the Netherlands, Sweden and Germany, for example, approximately 80 percent or more say the economy is doing well, but less than 40 percent believe the next generation will be better off than their parents. These views reflect a troubling reality: particularly in times of change and uncertainty [note: low growth hormone levels promote loss of confidence], people’s views are shaped more by emotions than rationality.” (S)
Populist leaders can therefore gain support through creating/compounding economic anxieties. Anxieties related to xenophobia seem to most often be an efficient way of gaining populist votes, but a combination of anxieties towards immigrants and economic worries seems to be an even more efficient combination for populists in many instances: “illegal immigrants stealing the jobs and committing crimes” or “selfish Jews hoarding capital at the top” for example are commonly used. These kinds of combinations of oxytocin and vasopressin enhanced anxieties have been used in order to make scapegoats and gain popularity through thousands of years of political history. (S)(S)(S) It should be noted that scapegoating is a mechanism that is common among social mammal species. (S)
Although populist nationalism has had various ways of manifesting, as structures of countries and also types of available ideologies have varied through the centuries, the manifestations of populist nationalism share many easily detectable similarities across millennia, which strongly indicates that the phenomenon has its roots directly in biology. Based on the presented studies, it can be stated that increased levels of dopamine may manifest as stronger levels of documented group behavior like in-group favoritism, out-group homogeneity, and group conformity (i.e. large-scale behavioral synchrony); trends that seem to be on the rise in the Western countries. (Everett et al., 2015238; Huang et al., 2019239)(S)(S)
3.4 Paths of tightening group cohesion
This [unfinished] chapter puts the proposed generational hormone theory to test by looking at an earlier peaks of nationalism, as the early 17th century contains clear signs of populism and rising feelings of early nationalism. 4th turnings have repeated every 80 to 90 years during the past few centuries, a rough estimation is: 1590-1610 | 1680-1700 | 1760-1780 | 1845-65 | 1925-1945 and currently 2010-2030.
The graphs in this chapter coarsely illustrate how tightening group cohesion during a 4th turning leads to different end results depending on the starting point that exists at the ending of a 3rd turning. This is in line with the Strauss-Howe generational theory: a society’s direction in a 4th turning is largely dependent on the situation it is in when a 4th turning begins, and that the beginning is marked by a catalytic event that starts the process towards a new order in the civic life as well.

Path 1 is the most common path and was explained earlier (chapter 2.3.1). Path 2 presents a situation where the ideological cleavages are already strong when entering a 4th turning, thus there is a risk of the divisions eventually splitting the main group into two (or possibly more) separate in-groups. The division into separate in-groups may eventually escalate into a conflict, but this would depend entirely on the contentious societal issues at hand. In this situation virtually everyone is situated on one side or another, thus scapegoating is rare because both sides try to garner as much supporters as possible, and the opposing group is blamed/scapegoated for at least the most pressing societal issues/problems.
But an external threat may also accomplish an unification during a 4th turning even if it is difficult otherwise, just like the rise of the Nazi Germany mostly suppressed the populist movements (but not nationalism) in many of the war waging countries during WW2, because the war efforts required cooperation basically at every level of a society. So path 2 can change into path 1 if the external threat is strong enough to unify the society.
Path 3 presented below is typical for dictatorships, kingdoms, and monarchies that have accumulated most if not all of the power to a small elite at the top.
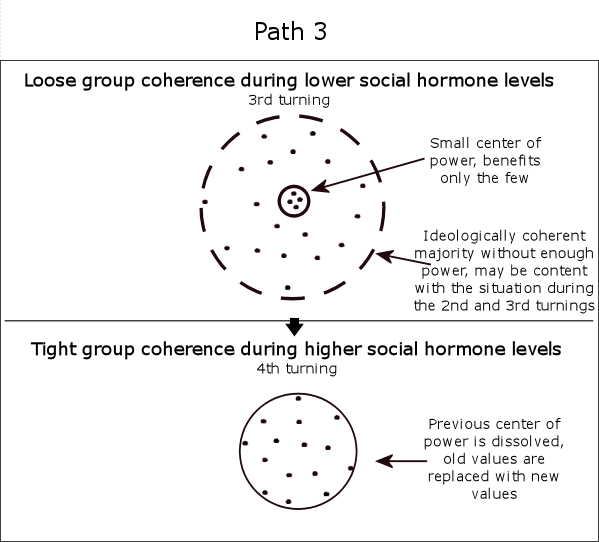
Below are examples of the paths taken regarding the US during the past three 4th turnings.
1) WW2 was preceded by path 1, while communists and fascists were the out-groups and scapegoats, and this way of thinking continued after the war.
2) The American Civil War was preceded by path 2. There were two distinct in-groups, the North and the South, and there were virtually no scapegoats apart from the other side.
3) The American Revolutionary War was preceded by path 3. The British were the out-group (although one third of the American colonists initially fought on the side of Britain).
In 2020, it seems that the current 4th turning path in the US is closest to path 2, while most of the other Western nations seem to be undergoing path 1, largely because their multi-party system decreases the probability of these nations splitting into two opposing camps.
When group cohesion tightens in a society, institutions will be used (or at least tried to be used) to advance the benefit of the in-group and simultaneously often to derogate an out-group. The usual targets are the justice system, army leadership, state media, and the education system, which are increasingly subjugated under the ruling party. Such mobilization of institutions is what has happened during the 4th turnings in history according to Strauss & Howe. People leading these institutions are increasingly expected to advance their own in-group’s agendas or the face being replaced by individuals who are more willing to advance the in-group’s causes.
If no ideological group can control all of the media, the media tends to polarize into two opposing camps, and this has manifested especially in the US during this 4th turning, where both ideological sides have their own news outlets, which only increases the cleavages between the two sides.
When nationalism rises and the unification is successful (or the society was already unified), there most often is a minority group or groups that the nationalists target, and the ones who belong to that minority group become scapegoats who will be blamed for many of the most pressing problems (real or made up problems) a nation faces: economic depression or economic inequality, crimes, disease, famine, or any other problem that affects the community negatively. Because scapegoating has been around for thousands of years and since scapegoating is found also in other animal species, it seems that it is an innate biological mechanism in humans, which utilizes the neural in-group vs. out-group setting. (S)
History shows that it really does not matter who the scapegoats are, basically any minority group can be used as a scapegoat. Since there must be someone to blame, suggests that if a community is very homogeneous in culture and ethnicity, like the Western European countries very much were during the 16th and 17th centuries, there can be imaginary scapegoats of groups/individuals like witches, who were blamed for things like disease or a village losing crops. (On a sidenote, witch hunts are still occurring in 21st century in India and Tanzania for instance.)
The two graphs below represent a simplified expression of higher and lower levels of social dominance and group cohesion effects in the history of the Western cultures, concentrating on the US. The idea is not to suggest that dopaminelevels would have directly caused any of these historical events, but if dopamine levels have been higher during certain eras, it may have facilitated eras of low and high degree of social dominance and group cohesion, during which such events may have become more probable to occur.
The blue line represents the dopamine oscillation in the US and potentially in other Western countries. High dopamine levels, or high levels of ‘social dominance & group cohesion’, largely coincides the political/ideological uprisings/revolutions that have often occurred during or close to the 4th turnings. Especially in the the history of the US, a 4th turning typically exhibits intensifying intra-group unity and/or inter-group tensions.


The specific path group-relations take during a 4th turning depend on the societal setting and group-relations (i.e. unity vs. disputes). To use the American Revolutionary War as an example: Great Britain held the most power over the US when the 4th turning began in 1770s, thus the increasing intra-group unity among the US population created an increasing inter-group cleavage between the US and Great Britain, which after a series of disputes resulted in a war for independence.
When group cohesion increases, the demand for institutions to take sides grows, since institutions have control over groups and individuals in a society. Institutions are basically “stable, valued, recurring patterns of behavior”. (S) Institutions on general can be divided into public (e.g. government, laws), private (e.g. companies, organizations), and cultural institutions (e.g. traditions, language).
The Strauss-Howe generational theory states that institutional power peaks during the 1st turning, which is when the social cohesion is also the strongest before declining again during the following turnings. Institutions enforce the common rules through the rule of law, but also through other means of influence.
Institutions represent feelings* of individuals as moral values through their rules and aims. [*How feelings shape institutions and organizations: a short video from a MIT professor in psychology, Stephen Chorover.] If the institutions do not represent the general will, aka ‘volonté générale‘ like Jean-Jacques Rousseau called it (S), there may be a revolt to overturn those institutions, something that has happened relatively often during the past few 4th turnings in history. (Chapter 3.4 presents the three basic paths societies usually take during eras of increasing social dominance and group cohesion.)
Chapter 4: Further discussion
4.1 Strenghts & weaknesses
This hypothesis has presented both a theoretical model and also statistical evidence of an evolutionary metapopulation mechanism, that creates and maintains the multiannual hormone cycle of cyclic animal populations. The mechanism creates the phase-dependent oscillations to the average physiological and behavioral traits of individual animals, and even though this hypothesis isn’t finished yet, the evolutionary advantages of the mechanism are already quite evident.
Although a few open questions regarding the phenomena of the multiannual population cycles remain for now, including the question of why populations of the same species can undergo cycles of different lengths at different geographic locations, the generational hormone cycle provides an answer to all of the previously unanswered questions regarding the phase-dependent physiological and behavioral phenomena, that always manifest in the same order during a multiannual animal population cycle. In addition, this hypothesis explains why the cycles can be in synchrony over vast geographical areas.
[The rest of the chapter currently concentrates on summing up the societal effects of the generational oscillating hormone levels in human populations.]
This hypothesis has also presented a theoretical model and evidence from many human populations to support the premise of a generational hormone cycle being active in several countries. Although more statistical evidence needs to be gathered to verify the generational oscillations to hormone levels, no other established explanations are available for the phenomena of the large societal shifts to rates of breastfeeding, crime or childlessness for example. This is especially evident when looking at the high degree of statistical synchrony between different countries, which is another phenomenon that the generational hormone theory explains.
It cannot be emphasized enough that hormone levels modulate behavior on an unconscious level, thus modulating the actions and reactions of individuals and groups on an unconscious level. The presented generational oscillations to hormone levels can create the generational traits listed by the Strauss-Howe generational theory.
The strength of the generational hormone theory is in the relative simplicity which allows overlooking individual differences received from genetics and environments by reviewing entire generations’ traits and actions. When looking at the current societal developments, the presented generational hormone theory is the only theory that addresses basically all of the central phenomena related to the rise of populist nationalism like rising feelings of nationalism, xenophobia (anti-Semitism, anti-Muslim sentiments, etc.), ideological and political polarization, and group serving lying (aka. post-truth era).
The generational hormone theory also addresses questions like why these phenomena are occurring today and why they are happening all around the Western nations – even in those nations that have not experienced major economic or civic difficulties for over two decades. The theory gives ground to the current slow abandonment of the “liberal status quo” inside many Western liberal democracies.
The more conventional and traditional viewpoints on history can be seen as “actions leading to consequences”, and then succeeding actions taken upon these consequences. The example used in the introductory chapter was the often repeated claim that the Great Depression of the 1930s largely caused the Nazi party to get to power in the pre-WW2 Germany. But such suggestions do not explain why the 1970s oil crisis did not cause any nationalistic movements. Obviously there were other reasons as well for the rise of the Nazi’s to power, such as the Treaty of Versailles, but such treaties have not commonly led to the rise of nationalism. So the explanation is a soup of consequences and actions which rarely solely cause large increases in nationalism, but together they somehow did. But even this does not explain the simultaneous rise of nationalism and anti-Semitism during the 1930s in other European nations.
Presuming that the model for the generational hormone cycle in human populations is at least somewhat accurate, predictions could be made about the upcoming years in general. But these predictions would obviously be only like weather forecasts that combine historical models of past 4th turnings with the current societal trends and events. The Fourth Turning book links the turnings to seasons of nature, as the exact conditions of seasons in nature cannot be known beforehand, but the seasons do run their course with very familiar and predictable patterns. This is also true regarding the animal population cycles, especially when looking at a metapopulation, whereas individual populations can more easily drop out of being cyclic for a period of multiple years.
‘Predicting the future’ of human societies has a slightly dubious ring to it, but is it predicting the future that a pre-pubertal individual will soon undergo years of increased irritability, mood swings, and changing sexual behavior? Or is it predicting the future to say that a woman close to her period may have increased irritability, mood swings, and changing sexual behavior? Or that a cyclic lemming population at the beginning of the cycle will first become less territorial and socially coherent for the next two years, and after that more territorial and socially coherent for the next two years. Presumably, all of these are predetermined hormonal events, where the timing is executed by biological clocks.
History cannot predict the future, but taking generationally oscillating hormone levels among human populations into account should provide more background to why notable historical events have manifested with a repeating rhythm of roughly 80 years. This would offer insight of the direction the current societal issues are pivoting towards.
So, presuming the hormone cycle’s oscillations are reasonably accurate, the trends listed below will presumably spread and gain popularity in the Western nations:
1) More populist nationalism and political polarization, and centrist parties will continue to lose support. The US will keep turning into a propaganda democracy with two diverging partisan ideological realities with different sets of facts.
2) Ideologically influenced news and also “fake news” will become increasingly efficient as receptivity for them increases. Conspiracy theories built around opposing in-group’s activities become more wide-spread.
3) More xenophobia and hate crimes in different forms towards out-groups, including hate speech, as acts of violence are increasingly based on inter-group issues. Armed militias and gangs will become more common.
4) Institutions and organizations (including companies), both public and private, will be increasingly demanded to take sides on societal issues or face the threat of boycotts.
Many European countries will presumably stay on the path on becoming more nationalistic and the EU may start to malfunction as individual countries oppose EU regulations regarding their internal agendas. More problems for example with Poland and Hungary are to be expected during 2020s. As populist parties grow in size, they may be increasingly accepted into governments. A lengthened economic recession or depression would very likely increase the “us vs. them” tensions greatly, since “they” (out-groups) are most often blamed for causing the economic downturn and/or making things worse during it.
4.2 Updates on recent societal events | 2020->
The generational hormone theory’s predictions for the upcoming years and decades were written mostly during 2018-19. These updates track the evolution of the central intra/inter-group relations among Western countries and other societal trends, and also geopolitical trends.
-May 2021 update to recent events: As predicted in the previous April 2020 update, since the pandemic started last year, nationalism has stayed at a high level and inter-group cleavages have increased. (S) The US and German parliaments were attacked by groups consisting (mostly) of far-right nationalists. (S)(S) BLM protests and riots were also signs of in-group tightening especially on the left-wing side of the political spectrum, and there were BLM protests around the Western countries. (S) Interest and support for Qanon increased noticeably once the pandemic started (S), and this trend has continued in 2021. (S) Anti-Semitism has stayed at high levels, breaking records in some countries. (S)(S) Cancel culture has remained strong in the Western countries. (S)(S)
-April 2022 update to recent events: Russia has begun invading Ukraine in the biggest land war in Europe after WWII (1939-45). Since Russia is the biggest perceived threat for the Western countries at the moment, the Western countries have unified towards a common goal of deterring Russia from continuing its invasion, which has resulted in the easing of inter-group tensions between and inside the Western countries. The length and severity of the crisis will largely define what the inter-group relations inside and between the Western nations are once the crisis is over.
Russia has encountered an unprecedented amount of sanctions and boycotts from the Western countries. Even countries like Germany are sending military and other aid to Ukraine, which would have been unthinkable before the invasion, and Poland is taking in hundreds of thousands of refugees even though they have taken in very few immigrants during the past decades. It could be said that the status quo of previous political alignments inside and between countries in the West and the East is currently heavily in flux.
-August 2022 update to recent events: The US has remained divided into two political camps, but there is a growing rift inside the Republican party: Trump supporters, that are more extreme right-wing than right-wing voters on average, are increasingly divided from the more moderate republicans, which may lead to less polarization in the US during the next few months and years, especially if Trump loses power among republican voters on general. The increasing perception of threat from the East, mainly from Russia and China, may further unite the US if no further domestic incidence results increased division.
Several EU countries have begun to restrain the movements of Russians, and these acts are likely to become more popular as the war is prolonged. It is also likely that some member states will need further financial assistance during the ongoing energy crisis, which should further deepen the integration of the EU both institutionally and also in a “nationalistic/unionistic sense” through having a common enemy in Russia.
-December 2022 update to recent events: The US election in November was very likely the last election where Trump had significant political support from the Republican party’s base, since the Republican party did not regain the majority in the Senate. The political fall of Trump will undoubtedly suppress the effectiveness of far-right populist messaging during the coming months, and even though there is still a possibility of another populist candidate to garner the far-right vote, it is likely that the movement cannot reach the levels of support the populists had between 2015 and 2020. [2025 update: Ffter the 2024 election that Trump’s movement won, it is clear that this prediction – which went against the generational hormone theory’s premises – was wrong in its final assumption.]
The war in Ukraine will likely be prolonged long into 2023, but because Russia has not regained any real momentum, their international support is likely to weaken among most former allies. European countries are still largely unified in their support for Ukraine, and it is likely that only a major economic downturn could falter the unity. Hungary has continued to fight the EU’s requests for reforms regarding certain laws and centralization of power, and Italy has elected the most far-right government since the 1940s, but the high levels of economic support these countries receive from the EU is likely to keep them from taking too extremist positions compared to the average ideological and institutional norms in the EU.
-November 2023 update to recent events: Although the recent increase of anti-Semitism to levels not seen after the previous 4th turning (1940s) are largely due to the currently ongoing conflict in the Middle East, acts of anti-Semitism have become more prevalent in the US and the EU during each year this 4th turning.
The rift in the Republican party between moderate and far-right members resulted in a three week period of the House of Representatives not being able to funtion properly because of not having a Speaker of the House after Kevin McCarthy was voted out despite the Republican majority. Despite Republicans losing more elections in Nov 2023 and getting indicted four times, Trump has regained much of the political support he had prior to the Jan 6th riot of 2021 in Washington DC, allowing him to remain the front-runner in the Republican party’s race for the presidency.
-July 2024 update to recent events: European party politics have become even more polarized as seen in the recent elections for the European parliament and French parlianment. Centriest parties have continued to lose support while far-left and especially far-right parties have gained more ground. This is due to increasing feelings of social dominance that basically causes group opinions and stances to continuously strengthen.
Geopolitical cleavages between the East and the West have continued to increase slowly but steadily with the increasing amount and strength of scrutiny between political leaders of Russia & China vs. the Western political leaders. Economic barriers, like the introduction of new tariffs, and the decreasing amount of economic cooperation between the East and the West have been highly visible. There is currently little to no reason to presume that these trends would not continue and even get stronger during the next few years.
-Mar 2025 update to recent events: As previously predicted, the US has implemented significant tariffs on imports, and more generally is aiming to boost domestic manufacturing of essential products and resources. This is fully in line with the Strauss-Howe generational theory’s analysis and prediction of the US becoming more self-reliant during 4th turnings. The EU has also raised tariffs on certain countries, which occurred before the current trade instabilities.
Societal polarizations have continued to affect companies. Several large companies have adjusted their policies according to the new “anti-woke” leadership in Washington. These actions have included toning down or ending DEI policies when hiring and social media companies loosening their cencorship standards. Tesla retailers and Tesla cars have been vandalized presumably solely due to Elon Musk aligning with certain far-right movements and his role in Trump’s new cabinet.
It is quite certain that economic and geopolitical tensions will keep increasing going forward, regardless of the developments between Russia and Ukraine. China’s pressure towards Taiwan has continued to increase and the coming years will show if China decides to initiate a blockade or other military efforts towards Taiwan. If this happens, the event is likely to define the “blocks of countries” that are either for or against China’s military efforts. The difficulty of taking sides in such a conflict would be more severe than what has been with Russia, as China is a much larger supplier of various goods and commodities than Russia. For the past decade or so, the US has been preparing for such an event, while the EU is lagging behind in these efforts.
-Jun 2026 update to recent events: The East vs. West geopolitical tensions have continued to escalate. The most recent and ongoing flashpoint is in Iran, where US and Israel attacked Iran with overwhelming miliraty force. Dismantling Iran’s nucler enrichment program was presumably the main goal for the US and Israel. Other probable goals include taking out Iran’s ballistic missile program, regime change, and other methods to stabilize the Middle East and lessen Chinese and Russian influence in the region.
The UK has become a center of attention during June due to anti-migrant sentiments increasing significantly during the last year or so. It is now clear that while the UK was previously on ‘path 3’ that led to Brexit (paths are covered in chapter 3.4 Paths of tightening group cohesion), the UK is now on paths 1 (i.e. exclusion) and 2 (i.e. division) and . Due to the UK’s current economic situation is currently perceived to be worsening, immigrants are likely to be increasingly blamed for negative societal issues, such as economic hardships and crime rates.
4.3 Further discussion
1) More hypothalamus-linked/neurosecretory hormones are to be included in this hypothesis, e.g. adrenalin, melatonin and somatostatin.
2) The current premise is that the cycles are synchronized by lunar and solar cycles. The vast majority of cyclic animal populations exist between 30 to 70 degrees northern latitude, which could be due to these latitudes having strong annual rhythms of nature. (Sinclair, 2003240; Kendall et al., 199815)
The occurrence and amplitude of mammalian cycles is strongest close to the northern latitude 55, which very closely corresponds with the minimum latitude in which nautical twilight can last all night near the summer solstice. During nautical twilight the illumination is such that the horizon is still visible even on a moonless night, meaning that it gets very dark even in the summer (compared to more northern latitudes), but the length of day is still very long (compared to more southern latitudes). (S) This latitude is where the changes in the length of day are the most pronounced, while still having a dark period every day of the year, which could be the explanation why this latitude sees the highest occurrence and amplitude regarding the cycles.
Circannual population cycles become increasingly rare below latitude 30, but there are clear differences between species and taxa how close to the equator annual reproductive cycles may exist. (Bronson, 1988168) Apart from some species maintaining annual breeding cycles that depend on a wet season, latitudes between 0 and 10 contain almost solely populations that do not have an annual reproductive rhythm.
The tropic has 0-2 hours of annual changes to light periods, which may explain the scarcity of continuous multiannual population cycles. Population outbreaks, like massive locust swarms, are typically triggered by the wet season: “Locusts begin to produce rapidly and become even more crowded together. In these circumstances, they shift completely from their solitary lifestyle to a group lifestyle in what’s called the gregarious phase. Locusts can even change color and body shape when they move into this phase. Their endurance increases and even their brains get larger.” (S)
3) Assuming that the premises presented in this hypothesis are correct, a question remains that Strauss & Howe pondered in their books: what would the modern history of the Western cultures look like without the generational hormone cycle? What if there weren’t eras of low group cohesion that presumably create high levels of individualism and crime, or eras of high group cohesion that create high rates of in-group favoritism and scapegoating of other groups?
The early 2000s in the Western nations could be a relatively good reference point for such an era: no ideological battles that consume everything in politics, low levels of populism, relatively good relations between most nations, no large-scale wars between coalitions, no significant culture of over-selfishness nor ideological groupthink, and individuals are relatively stress free and reasonably optimistic about the future.
4.4 Materials
Interviews & presentations:
Other mentions:
A note from Richard Smith (Foundation for the Study of Cycles)
References
- 1.Myers JH. Population cycles: generalities, exceptions and remaining mysteries. Proc R Soc B. Published online March 21, 2018:20172841. doi:10.1098/rspb.2017.2841
- 2.ELTON CS. Periodic Fluctuations in the Numbers of Animals: Their Causes and Effects. Journal of Experimental Biology. Published online October 1, 1924:119-163. doi:10.1242/jeb.2.1.119
- 3.Wang H, Nagy JD, Gilg O, Kuang Y. The roles of predator maturation delay and functional response in determining the periodicity of predator–prey cycles. Mathematical Biosciences. Published online September 2009:1-10. doi:10.1016/j.mbs.2009.06.004
- 4.Krebs CJ. Of lemmings and snowshoe hares: the ecology of northern Canada. Proc R Soc B. Published online October 27, 2010:481-489. doi:10.1098/rspb.2010.1992
- 5.Krebs CJ, Bryant J, Kielland K, et al. What factors determine cyclic amplitude in the snowshoe hare (Lepus americanus) cycle? Can J Zool. Published online December 2014:1039-1048. doi:10.1139/cjz-2014-0159
- 6.Wiger R. Roles of Self Regulatory Mechanisms in Cyclic Populations of Clethrionomys with Special Reference to C. Glareolus: A Hypothesis. Oikos. Published online January 1982:60. doi:10.2307/3544568
- 7.Hansson L, Henttonen H. Gradients in density variations of small rodents: the importance of latitude and snow cover. Oecologia. Published online October 1985:394-402. doi:10.1007/bf00384946
- 8.Angerbjörn A, Tannerfeldt M, Lundberg H. Geographical and temporal patterns of lemming population dynamics in Fennoscandia. Ecography. Published online June 2001:298-308. doi:10.1034/j.1600-0587.2001.240307.x
- 9.Gunn A. Voles, lemmings and caribou – population cycles revisited? Ran. Published online April 1, 2003:105. doi:10.7557/2.23.5.1689
- 10.Esper J, Büntgen U, Frank DC, Nievergelt D, Liebhold A. 1200 years of regular outbreaks in alpine insects. Proc R Soc B. Published online December 12, 2006:671-679. doi:10.1098/rspb.2006.0191
- 11.Baltensweiler W, Fischlin A. The Larch Budmoth in the Alps. Dynamics of Forest Insect Populations. Published online 1988:331-351. doi:10.1007/978-1-4899-0789-9_17
- 12.Witting L. Population Cycles Caused by Selection by Density Dependent Competitive Interactions. Bulletin of Mathematical Biology. Published online November 2000:1109-1136. doi:10.1006/bulm.2000.0200
- 13.Wilson White J, Botsford LW, Hastings A, Holland MD. Stochastic models reveal conditions for cyclic dominance in sockeye salmon populations. Ecological Monographs. Published online February 2014:69-90. doi:10.1890/12-1796.1
- 14.Kshnyasev IA, Davydova YuA. Population Cycles and the Chitty Syndrome. Russ J Ecol. Published online January 2021:70-75. doi:10.1134/s1067413621010082
- 15.Kendall, Prendergast, Bjornstad. The macroecology of population dynamics: taxonomic and biogeographic patterns in population cycles. Ecol Letters. Published online November 1998:160-164. doi:10.1046/j.1461-0248.1998.00037.x
- 16.Witteman GJ, Redfearn A, Pimm SL. The extent of complex population changes in nature. Evol Ecol. Published online April 1990:173-183. doi:10.1007/bf02270914
- 17.Ecological orbits: how planets move and populations grow. Choice Reviews Online. Published online February 1, 2005:42-3404-42-3404. doi:10.5860/choice.42-3404
- 18.Edwards PD, Palme R, Boonstra R. Is chronic stress a causal mechanism for small mammal population cycles? Reconciling the evidence. Oecologia. Published online March 2023:609-623. doi:10.1007/s00442-023-05338-5
- 19.Sundell J, Ylönen H, Haapakoski M. Do phase-dependent life history traits in cyclic voles persist in a common environment? Oecologia. Published online May 7, 2019:399-410. doi:10.1007/s00442-019-04410-3
- 20.Juckett D. Hypotheses and models linking epigenetic transgenerational effects to population dynamics: Exploring oscillations and applications to wildlife cycles. Published online May 7, 2020. doi:10.1101/2020.05.05.079129
- 21.Levay EA, Nasser H, Zelko MD, Penman J, Johns TG. Lemming and Vole Cycles: A New Intrinsic Model. Ecology and Evolution. Published online October 2024. doi:10.1002/ece3.70440
- 22.FRECKLETON RP, WATKINSON AR, GREEN RE, SUTHERLAND WJ. Census error and the detection of density dependence. Journal of Animal Ecology. Published online June 23, 2006:837-851. doi:10.1111/j.1365-2656.2006.01121.x
- 23.Andreassen HP, Sundell J, Ecke F, et al. Population cycles and outbreaks of small rodents: ten essential questions we still need to solve. Oecologia. Published online December 28, 2020:601-622. doi:10.1007/s00442-020-04810-w
- 24.Oli MK. Population cycles in voles and lemmings: state of the science and future directions. Mam Rev. Published online May 10, 2019:226-239. doi:10.1111/mam.12156
- 25.LINDSTRÖM J, RANTA E, KOKKO H, LUNDBERG P, KAITALA V. From arctic lemmings to adaptive dynamics: Charles Elton’s legacy in population ecology. Biol Rev. Published online February 2001:129-158. doi:10.1017/s1464793100005637
- 26.Oli MK. Population cycles of small rodents are caused by specialist predators: or are they? Trends in Ecology & Evolution. Published online March 2003:105-107. doi:10.1016/s0169-5347(03)00005-3
- 27.Martínez-Padilla J, Redpath SM, Zeineddine M, Mougeot F. Insights into population ecology from long-term studies of red grouseLagopus lagopus scoticus. Wilson K, ed. J Anim Ecol. Published online June 25, 2013:85-98. doi:10.1111/1365-2656.12098
- 28.Giraudoux P, Villette P, Quéré JP, Damange JP, Delattre P. Weather influences M. arvalis reproduction but not population dynamics in a 17-year time series. Sci Rep. Published online September 26, 2019. doi:10.1038/s41598-019-50438-z
- 29.BROMMER JE, PIETIÄINEN H, AHOLA K, KARELL P, KARSTINEN T, KOLUNEN H. The return of the vole cycle in southern Finland refutes the generality of the loss of cycles through ‘climatic forcing.’ Global Change Biology. Published online January 4, 2010:577-586. doi:10.1111/j.1365-2486.2009.02012.x
- 30.Siehler O, Wang S, Bloch G. Social synchronization of circadian rhythms with a focus on honeybees. Phil Trans R Soc B. Published online August 23, 2021. doi:10.1098/rstb.2020.0342
- 31.Baghel KK, Pati AK. Pheromones as time cues for circadian rhythms in fish. Biological Rhythm Research. Published online May 26, 2015:659-669. doi:10.1080/09291016.2015.1046246
- 32.Groot AT. Circadian rhythms of sexual activities in moths: a review. Front Ecol Evol. Published online August 7, 2014. doi:10.3389/fevo.2014.00043
- 33.Fuchikawa T, Eban-Rothschild A, Nagari M, Shemesh Y, Bloch G. Potent social synchronization can override photic entrainment of circadian rhythms. Nat Commun. Published online May 23, 2016. doi:10.1038/ncomms11662
- 34.Thomas KA, Burr RL, Spieker S. Light and maternal influence in the entrainment of activity circadian rhythm in infants 4–12 weeks of age. Sleep Biol Rhythms. Published online January 5, 2016:249-255. doi:10.1007/s41105-015-0046-2
- 35.Bloch G, Herzog ED, Levine JD, Schwartz WJ. Socially synchronized circadian oscillators. Proc R Soc B. Published online August 22, 2013:20130035. doi:10.1098/rspb.2013.0035
- 36.Davidson AJ, Menaker M. Birds of a feather clock together – sometimes: social synchronization of circadian rhythms. Current Opinion in Neurobiology. Published online December 2003:765-769. doi:10.1016/j.conb.2003.10.011
- 37.Arshavskaya T, Polenov A, Tkachev A. The hypothalamo-hypophysial system of the lemming, Dicrostonyx torquatus Pallas. III. Population aspects of neuroendocrine regulation. Z Mikrosk Anat Forsch. 1989;103(4):627-647. https://www.ncbi.nlm.nih.gov/pubmed/2683448
- 38.Vladimirova EG, Chernigovskaya EV, Danilova OA. Hypothalamo-pituitary neurosecretory system of the Northern redbacked vole Clethrionomys rutilus in the course of population cycle. J Evol Biochem Phys. Published online March 2006:208-216. doi:10.1134/s002209300602013x
- 39.Christian JJ. The Adreno-Pituitary System and Population Cycles in Mammals. Journal of Mammalogy. Published online August 1950:247. doi:10.2307/1375290
- 40.Sheriff MJ, Krebs CJ, Boonstra R. From process to pattern: how fluctuating predation risk impacts the stress axis of snowshoe hares during the 10-year cycle. Oecologia. Published online January 19, 2011:593-605. doi:10.1007/s00442-011-1907-2
- 41.Davis GJ, Meyer RK. FSH and LH in the snowshoe hare during the increasing phase of the 10-year cycle. General and Comparative Endocrinology. Published online February 1973:53-60. doi:10.1016/0016-6480(73)90129-9
- 42.Tähkä KM, Wallgren H, Vuorinen A. Endocrine Aspects of Population Regulation in the Genus Clethrionymus, , 1984, vol. 60, pp. 93–106. Mem Soc Fauna Flora Fenn. 1984;60:93–106.
- 43.Ozgul A, Getz LL, Oli MK. Demography of fluctuating populations: temporal and phase-related changes in vital rates of Microtus ochrogaster. J Anim Ecology. Published online March 2004:201-215. doi:10.1111/j.0021-8790.2004.00797.x
- 44.Cary JR, Keith LB. Reproductive change in the 10-year cycle of snowshoe hares. Can J Zool. Published online February 1, 1979:375-390. doi:10.1139/z79-044
- 45.Boonstra R, Hik D, Singleton GR, Tinnikov A. THE IMPACT OF PREDATOR-INDUCED STRESS ON THE SNOWSHOE HARE CYCLE. Ecological Monographs. Published online August 1998:371-394. doi:10.1890/0012-9615(1998)068[0371:tiopis]2.0.co;2
- 46.Eberhardt LL. A PARADIGM FOR POPULATION ANALYSIS OF LONG-LIVED VERTEBRATES. Ecology. Published online October 2002:2841-2854. doi:10.1890/0012-9658(2002)083[2841:apfpao]2.0.co;2
- 47.LAMBIN X, BRETAGNOLLE V, YOCCOZ NG. Vole population cycles in northern and southern Europe: Is there a need for different explanations for single pattern? Journal of Animal Ecology. Published online March 8, 2006:340-349. doi:10.1111/j.1365-2656.2006.01051.x
- 48.Olea PP, de Diego N, García JT, Viñuela J. Habitat type modulates sharp body mass oscillations in cyclic common vole populations. Sci Rep. Published online May 26, 2024. doi:10.1038/s41598-024-62687-8
- 49.Cheprakov MI. Components of the chitty effect. Russ J Ecol. Published online October 25, 2011:529-531. doi:10.1134/s1067413611060051
- 50.Oli MK. The Chitty Effect: A Consequence of Dynamic Energy Allocation in a Fluctuating Environment. Theoretical Population Biology. Published online December 1999:293-300. doi:10.1006/tpbi.1999.1427
- 51.Fauteux D, Gauthier G, Berteaux D. Seasonal demography of a cyclic lemming population in the Canadian Arctic. Ims R, ed. J Anim Ecol. Published online July 15, 2015:1412-1422. doi:10.1111/1365-2656.12385
- 52.Wolff JO. Does the “Chitty Effect” Occur in Peromyscus? Journal of Mammalogy. Published online November 30, 1993:846-851. doi:10.2307/1382422
- 53.Yakushov VD, Sheftel BI. Is There a Relationship between the Chitty Effect and the Types of Population Dynamics? Dokl Biol Sci. Published online May 2020:89-92. doi:10.1134/s0012496620030084
- 54.Majchrzak YN, Peers MJL, Studd EK, et al. Balancing food acquisition and predation risk drives demographic changes in snowshoe hare population cycles. Sih A, ed. Ecology Letters. Published online February 11, 2022:981-991. doi:10.1111/ele.13975
- 55.Rhainds M. Variation in Wing Load of Female Spruce Budworms (Lepidoptera: Tortricidae) During the Course of an Outbreak: Evidence for Phenotypic Response to Habitat Deterioration in Collapsing Populations. Sword G, ed. Environmental Entomology. Published online December 20, 2019:238-245. doi:10.1093/ee/nvz144
- 56.Albon SD, Clutton-Brock TH, Guinness FE. Early Development and Population Dynamics in Red Deer. II. Density-Independent Effects and Cohort Variation. The Journal of Animal Ecology. Published online February 1987:69. doi:10.2307/4800
- 57.Klemola T, Andersson T, Ruohomäki K. Fecundity of the autumnal moth depends on pooled geometrid abundance without a time lag: implications for cyclic population dynamics. J Anim Ecology. Published online May 2008:597-604. doi:10.1111/j.1365-2656.2008.01369.x
- 58.Klemola T, Ruohomäki K, Andersson T, Neuvonen S. Reduction in size and fecundity of the autumnal moth, Epirrita autumnata, in the increase phase of a population cycle. Oecologia. Published online July 29, 2004:47-56. doi:10.1007/s00442-004-1642-z
- 59.Geller MD, Christian JJ. Population Dynamics, Adrenocortical Function, and Pathology in Microtus pennsylvanicus. Journal of Mammalogy. Published online February 25, 1982:85-95. doi:10.2307/1380674
- 60.Niklasson B, Nyholm E, Feinstein RE, Samsioe A, Hörnfeldt B. Diabetes and myocarditis in voles and lemmings at cyclic peak densities—induced by Ljungan virus? Oecologia. Published online July 26, 2006:1-7. doi:10.1007/s00442-006-0493-1
- 61.Christian JJ, Flyger V, Davis DE. Factors in the Mass Mortality of a Herd of Sika Deer, Cervus nippon. Chesapeake Science. Published online June 1960:79. doi:10.2307/1350924
- 62.Yamaguchi Y, Lee YA, Kato A, Jas E, Goto Y. The Roles of Dopamine D2 Receptor in the Social Hierarchy of Rodents and Primates. Sci Rep. Published online February 24, 2017. doi:10.1038/srep43348
- 63.Nader MA, Nader SH, Czoty PW, et al. Social Dominance in Female Monkeys: Dopamine Receptor Function and Cocaine Reinforcement. Biological Psychiatry. Published online September 2012:414-421. doi:10.1016/j.biopsych.2012.03.002
- 64.Ghosal S, Sandi C, van der Kooij MA. Neuropharmacology of the mesolimbic system and associated circuits on social hierarchies. Neuropharmacology. Published online November 2019:107498. doi:10.1016/j.neuropharm.2019.01.013
- 65.Dwortz MF, Curley JP, Tye KM, Padilla-Coreano N. Neural systems that facilitate the representation of social rank. Phil Trans R Soc B. Published online January 10, 2022. doi:10.1098/rstb.2020.0444
- 66.Pignatelli M, Umanah GKE, Ribeiro SP, et al. Synaptic Plasticity onto Dopamine Neurons Shapes Fear Learning. Neuron. Published online January 2017:425-440. doi:10.1016/j.neuron.2016.12.030
- 67.Wenzel JM, Oleson EB, Gove WN, et al. Phasic Dopamine Signals in the Nucleus Accumbens that Cause Active Avoidance Require Endocannabinoid Mobilization in the Midbrain. Current Biology. Published online May 2018:1392-1404.e5. doi:10.1016/j.cub.2018.03.037
- 68.Salinas-Hernández XI, Duvarci S. Dopamine in Fear Extinction. Front Synaptic Neurosci. Published online March 1, 2021. doi:10.3389/fnsyn.2021.635879
- 69.Marzecová A, Kaiser LF, Maddah A. Neuromodulation of Foraging Decisions: The Role of Dopamine. Front Behav Neurosci. Published online April 13, 2021. doi:10.3389/fnbeh.2021.660667
- 70.Matthews GA, Nieh EH, Vander Weele CM, et al. Dorsal Raphe Dopamine Neurons Represent the Experience of Social Isolation. Cell. Published online February 2016:617-631. doi:10.1016/j.cell.2015.12.040
- 71.Mahabir S, Chatterjee D, Buske C, Gerlai R. Maturation of shoaling in two zebrafish strains: A behavioral and neurochemical analysis. Behavioural Brain Research. Published online June 2013:1-8. doi:10.1016/j.bbr.2013.03.013
- 72.Krebs CJ, Boonstra R, Boutin S, et al. Trophic Dynamics of the Boreal Forests of the Kluane Region. ARCTIC. Published online January 13, 2014:71. doi:10.14430/arctic4350
- 73.Marjomäki TJ, Auvinen H, Helminen H, et al. Occurrence of Two-Year Cyclicity, “Saw-Blade Fluctuation”, in Vendace Populations in Finland. Annales Zoologici Fennici. Published online September 6, 2021. doi:10.5735/086.058.0408
- 74.Moss R, Storch I, Müller M. Trends in grouse research. Wildlife Biology. Published online March 2010:1-11. doi:10.2981/09-055
- 75.Bjørnstad ON, Liebhold AM, Johnson DM. Transient synchronization following invasion: revisiting Moran’s model and a case study. Population Ecology. Published online August 5, 2008:379-389. doi:10.1007/s10144-008-0105-5
- 76.Clarke JR. Long and Short Term Changes in Gonadal Activity of Field Voles and Bank Voles. Oikos. Published online 1977:457. doi:10.2307/3543587
- 77.Högstedt G, Seldal T, Breistøl A. PERIOD LENGTH IN CYCLIC ANIMAL POPULATIONS. Ecology. Published online February 2005:373-378. doi:10.1890/02-0561
- 78.Zamin TJ, Grogan P. Caribou exclusion during a population low increases deciduous and evergreen shrub species biomass and nitrogen pools in low<scp>A</scp>rctic tundra. Brooker R, ed. J Ecol. Published online April 24, 2013:671-683. doi:10.1111/1365-2745.12082
- 79.Arnold DA, Breed GA, Laufenberg JS, et al. Evidence for a survival-driven traveling wave in a keystone boreal predator population. Proc Natl Acad Sci USA. Published online September 30, 2024. doi:10.1073/pnas.2414052121
- 80.Nagy C, Turecki G. Sensitive Periods in Epigenetics: Bringing us Closer to Complex Behavioral Phenotypes. Epigenomics. Published online August 2012:445-457. doi:10.2217/epi.12.37
- 81.Abbott KC. A dispersal-induced paradox: synchrony and stability in stochastic metapopulations. Ecology Letters. Published online August 4, 2011:1158-1169. doi:10.1111/j.1461-0248.2011.01670.x
- 82.Liebhold A, Koenig WD, Bjørnstad ON. Spatial Synchrony in Population Dynamics. Annu Rev Ecol Evol Syst. Published online December 15, 2004:467-490. doi:10.1146/annurev.ecolsys.34.011802.132516
- 83.Andreatta G, Tessmar-Raible K. The Still Dark Side of the Moon: Molecular Mechanisms of Lunar-Controlled Rhythms and Clocks. Journal of Molecular Biology. Published online May 2020:3525-3546. doi:10.1016/j.jmb.2020.03.009
- 84.Kaiser TS, Neumann J. Circalunar clocks—Old experiments for a new era. BioEssays. Published online May 29, 2021:2100074. doi:10.1002/bies.202100074
- 85.Helfrich-Förster C, Monecke S, Spiousas I, Hovestadt T, Mitesser O, Wehr TA. Women temporarily synchronize their menstrual cycles with the luminance and gravimetric cycles of the Moon. Sci Adv. Published online January 29, 2021. doi:10.1126/sciadv.abe1358
- 86.Skov MW, Hartnoll RG, Ruwa RK, Shunula JP, Vannini M, Cannicci S. MARCHING TO A DIFFERENT DRUMMER: CRABS SYNCHRONIZE REPRODUCTION TO A 14-MONTH LUNAR-TIDAL CYCLE. Ecology. Published online May 2005:1164-1171. doi:10.1890/04-0917
- 87.Haigh ID, Eliot M, Pattiaratchi C. Global influences of the 18.61 year nodal cycle and 8.85 year cycle of lunar perigee on high tidal levels. J Geophys Res. Published online June 29, 2011. doi:10.1029/2010jc006645
- 88.Peng D, Hill EM, Meltzner AJ, Switzer AD. Tide Gauge Records Show That the 18.61‐Year Nodal Tidal Cycle Can Change High Water Levels by up to 30 cm. J Geophys Res Oceans. Published online January 2019:736-749. doi:10.1029/2018jc014695
- 89.Bevington M. Lunar biological effects and the magnetosphere. Pathophysiology. Published online December 2015:211-222. doi:10.1016/j.pathophys.2015.08.005
- 90.Archibald HL. The enigma of the 10-year wildlife population cycle solved? Evidence that the periodicity and regularity of the cycle are driven by a lunar zeitgeber. Can Field Nat. Published online January 28, 2015:327. doi:10.22621/cfn.v128i4.1626
- 91.Selås V. Annual change in forest grouse in southern Norway: variation explained by temperatures, bilberry seed production and the lunar nodal phase cycle. Wildlife Biology. Published online September 18, 2019. doi:10.2981/wlb.00536
- 92.Archibald H. Prediction of Autumnal Moth Peak Years of Abundance. Unpublished. Preprint posted online 2020. doi:10.13140/RG.2.2.24119.91045
- 93.Archibald H. The Larch Budmoth Cycle in the Swiss Alps. Unpublished. Published online 2023. doi:10.13140/RG.2.2.33687.34723
- 94.Selås V, Kobro S. The lunar nodal phase cycle and winter atmospheric pressure as possible determinants of moth abundance: Analyses of a 30‐year time series from South Norway. Ecology and Evolution. Published online October 2022. doi:10.1002/ece3.9443
- 95.Yndestad H. The influence of long tides on ecosystem dynamics in the Barents Sea. Deep Sea Research Part II: Topical Studies in Oceanography. Published online October 2009:2108-2116. doi:10.1016/j.dsr2.2008.11.022
- 96.Archibald HL. Relating the 4-year lemming (Lemmusspp. andDicrostonyxspp.) population cycle to a 3.8-year lunar cycle and ENSO. Can J Zool. Published online November 2019:1054-1063. doi:10.1139/cjz-2018-0266
- 97.Selås V. Radon as a possible link between peak spring tides and lemming cycles. Acta Oecologica. Published online May 2024:103987. doi:10.1016/j.actao.2024.103987
- 98.Hurt PR, Libby LM, Pandolfi LJ, Levine LH, Van Engel WA. Periodicities in blue crab population of Chesapeake Bay. Climatic Change. Published online March 1979:75-78. doi:10.1007/bf00138228
- 99.Higgins K, Hastings A, Botsford LW. Density Dependence and Age Structure: Nonlinear Dynamics and Population Behavior. The American Naturalist. Published online February 1997:247-269. doi:10.1086/285989
- 100.Klvana I, Berteaux D, Cazelles B. Porcupine Feeding Scars and Climatic Data Show Ecosystem Effects of the Solar Cycle. The American Naturalist. Published online September 2004:283-297. doi:10.1086/423431
- 101.Bhattacharyya S. Possible association between Indian monsoon rainfall and solar activity. Geophys Res Lett. Published online 2005. doi:10.1029/2004gl021044
- 102.GWINNER E. Circannual clocks in avian reproduction and migration. Ibis. Published online January 1996:47-63. doi:10.1111/j.1474-919x.1996.tb04312.x
- 103.Daftary GS, Taylor HS. Endocrine Regulation of HOX Genes. Endocrine Reviews. Published online April 21, 2006:331-355. doi:10.1210/er.2005-0018
- 104.Lutchmaya S, Baron-Cohen S, Raggatt P, Knickmeyer R, Manning JT. 2nd to 4th digit ratios, fetal testosterone and estradiol. Early Human Development. Published online April 2004:23-28. doi:10.1016/j.earlhumdev.2003.12.002
- 105.Engen S, Wright J, Araya‐Ajoy YG, Sæther B. Phenotypic evolution in stochastic environments: The contribution of frequency‐ and density‐dependent selection. Evolution. Published online July 26, 2020:1923-1941. doi:10.1111/evo.14058
- 106.Brockhurst MA, Chapman T, King KC, Mank JE, Paterson S, Hurst GDD. Running with the Red Queen: the role of biotic conflicts in evolution. Proc R Soc B. Published online December 22, 2014:20141382. doi:10.1098/rspb.2014.1382
- 107.Strotz LC, Simões M, Girard MG, Breitkreuz L, Kimmig J, Lieberman BS. Getting somewhere with the Red Queen: chasing a biologically modern definition of the hypothesis. Biol Lett. Published online May 2018:20170734. doi:10.1098/rsbl.2017.0734
- 108.Walter JA, Johnson DM, Tobin PC, Haynes KJ. Population cycles produce periodic range boundary pulses. Ecography. Published online March 19, 2015:1200-1211. doi:10.1111/ecog.01364
- 109.Franklin MT, Myers JH, Cory JS. Genetic Similarity of Island Populations of Tent Caterpillars during Successive Outbreaks. López-Vaamonde C, ed. PLoS ONE. Published online May 23, 2014:e96679. doi:10.1371/journal.pone.0096679
- 110.Rikalainen K, Aspi J, Galarza JA, Koskela E, Mappes T. Maintenance of genetic diversity in cyclic populations-a longitudinal analysis inMyodes glareolus. Ecology and Evolution. Published online June 11, 2012:1491-1502. doi:10.1002/ece3.277
- 111.Ehrich D, Jorde PE. HIGH GENETIC VARIABILITY DESPITE HIGH-AMPLITUDE POPULATION CYCLES IN LEMMINGS. Journal of Mammalogy. Published online April 2005:380-385. doi:10.1644/ber-126.1
- 112.Artzy-Randrup Y, Stone L. Connectivity, Cycles, and Persistence Thresholds in Metapopulation Networks. Bascompte J, ed. PLoS Comput Biol. Published online August 5, 2010:e1000876. doi:10.1371/journal.pcbi.1000876
- 113.Tromeur E, Rudolf L, Gross T. Impact of dispersal on the stability of metapopulations. Journal of Theoretical Biology. Published online March 2016:1-11. doi:10.1016/j.jtbi.2015.11.029
- 114.Ishibashi Y, Takahashi K. Role of individual dispersal in genetic resilience in fluctuating populations of the gray‐sided vole Myodes rufocanus. Ecol Evol. Published online February 21, 2021:3407-3421. doi:10.1002/ece3.7300
- 115.Lidicker WZ Jr. Genetic and spatial structuring of the California vole (Microtus californicus) through a multiannual density peak and decline. JMAMMAL. Published online August 18, 2015:1142-1151. doi:10.1093/jmammal/gyv122
- 116.Norén K, Angerbjörn A. Genetic perspectives on northern population cycles: bridging the gap between theory and empirical studies. Biol Rev. Published online November 4, 2013:493-510. doi:10.1111/brv.12070
- 117.Krebs CJ, Boonstra R, Boutin S. Using experimentation to understand the 10‐year snowshoe hare cycle in the boreal forest of North America. Wilson K, ed. J Anim Ecol. Published online July 24, 2017:87-100. doi:10.1111/1365-2656.12720
- 118.Berthier K, Piry S, Cosson JF, et al. Dispersal, landscape and travelling waves in cyclic vole populations. Liebhold A, ed. Ecol Lett. Published online November 17, 2013:53-64. doi:10.1111/ele.12207
- 119.Sherratt JA, Smith MJ. Periodic travelling waves in cyclic populations: field studies and reaction–diffusion models. J R Soc Interface. Published online January 22, 2008:483-505. doi:10.1098/rsif.2007.1327
- 120.Jepsen JU, Vindstad OPL, Barraquand F, Ims RA, Yoccoz NG. Continental-scale travelling waves in forest geometrids in Europe: an evaluation of the evidence. White A, ed. J Anim Ecol. Published online January 16, 2016:385-390. doi:10.1111/1365-2656.12444
- 121.Walter JA, Sheppard LW, Anderson TL, et al. The geography of spatial synchrony. Blasius B, ed. Ecol Lett. Published online May 26, 2017:801-814. doi:10.1111/ele.12782
- 122.Peacock MM, McCullough DR. Metapopulations and Wildlife Conservation. Ecology. Published online September 1997:1937. doi:10.2307/2266116
- 123.Fletcher NK, Acevedo P, Herman JS, Paupério J, Alves PC, Searle JB. Glacial cycles drive rapid divergence of cryptic field vole species. Ecol Evol. Published online November 23, 2019:14101-14113. doi:10.1002/ece3.5846
- 124.Ecke F, Angeler DG, Magnusson M, Khalil H, Hörnfeldt B. Dampening of population cycles in voles affects small mammal community structure, decreases diversity, and increases prevalence of a zoonotic disease. Ecol Evol. Published online June 9, 2017:5331-5342. doi:10.1002/ece3.3074
- 125.Vahdati AR, Sprouffske K, Wagner A. Effect of Population Size and Mutation Rate on the Evolution of RNA Sequences on an Adaptive Landscape Determined by RNA Folding. Int J Biol Sci. Published online 2017:1138-1151. doi:10.7150/ijbs.19436
- 126.Lundvall D, Svanbäck R, Persson L, Byström P. Size-dependent predation in piscivores: interactions between predator foraging and prey avoidance abilities. Can J Fish Aquat Sci. Published online July 1, 1999:1285-1292. doi:10.1139/f99-058
- 127.Nguyen J, Lara-Gutiérrez J, Stocker R. Environmental fluctuations and their effects on microbial communities, populations and individuals. FEMS Microbiology Reviews. Published online December 18, 2020. doi:10.1093/femsre/fuaa068
- 128.Himeoka Y, Mitarai N. Dynamics of bacterial populations under the feast-famine cycles. Phys Rev Research. Published online March 27, 2020. doi:10.1103/physrevresearch.2.013372
- 129.Gokhale S, Conwill A, Ranjan T, Gore J. Migration alters oscillatory dynamics and promotes survival in connected bacterial populations. Nat Commun. Published online December 10, 2018. doi:10.1038/s41467-018-07703-y
- 130.Martel J, Chang SH, Chevalier G, Ojcius DM, Young JD. Influence of electromagnetic fields on the circadian rhythm: Implications for human health and disease. Biomedical Journal. Published online February 2023:48-59. doi:10.1016/j.bj.2023.01.003
- 131.Bandara P, Carpenter DO. Planetary electromagnetic pollution: it is time to assess its impact. The Lancet Planetary Health. Published online December 2018:e512-e514. doi:10.1016/s2542-5196(18)30221-3
- 132.Karashchuk OS, Mayorova EA, Nikishin AF, Kornilova OV. The Method for Determining Time-Generation Range. SAGE Open. Published online October 2020:215824402096808. doi:10.1177/2158244020968082
- 133.Costanza DP, Rudolph CW, Zacher H. Are generations a useful concept? Acta Psychologica. Published online November 2023:104059. doi:10.1016/j.actpsy.2023.104059
- 134.Strauss W, Howe N. Generations. William Morrow and Co; 1991.
- 135.Pletzer B, Harris TA, Scheuringer A, Hidalgo-Lopez E. The cycling brain: menstrual cycle related fluctuations in hippocampal and fronto-striatal activation and connectivity during cognitive tasks. Neuropsychopharmacol. Published online June 13, 2019:1867-1875. doi:10.1038/s41386-019-0435-3
- 136.Simonneaux V, Bahougne T. A Multi-Oscillatory Circadian System Times Female Reproduction. Front Endocrinol. Published online October 20, 2015. doi:10.3389/fendo.2015.00157
- 137.Allocco DJ, Song Q, Gibbons GH, Ramoni MF, Kohane IS. Geography and genography: prediction of continental origin using randomly selected single nucleotide polymorphisms. BMC Genomics. Published online 2007:68. doi:10.1186/1471-2164-8-68
- 138.Caldwell HK, Albers HE. Oxytocin, Vasopressin, and the Motivational Forces that Drive Social Behaviors. In: Behavioral Neuroscience of Motivation. Springer International Publishing; 2015:51-103. doi:10.1007/7854_2015_390
- 139.Pearce E, Wlodarski R, Machin A, Dunbar RIM. Variation in the β-endorphin, oxytocin, and dopamine receptor genes is associated with different dimensions of human sociality. Proc Natl Acad Sci USA. Published online May 1, 2017:5300-5305. doi:10.1073/pnas.1700712114
- 140.Lewis GJ, Bates TC. Genetic Evidence for Multiple Biological Mechanisms Underlying In-Group Favoritism. Psychol Sci. Published online October 25, 2010:1623-1628. doi:10.1177/0956797610387439
- 141.Lewis GJ, Bates TC. The Temporal Stability of In-Group Favoritism Is Mostly Attributable to Genetic Factors. Social Psychological and Personality Science. Published online June 7, 2017:897-903. doi:10.1177/1948550617699250
- 142.Fowden AL, Forhead AJ. Hormones as epigenetic signals in developmental programming. Experimental Physiology. Published online May 14, 2009:607-625. doi:10.1113/expphysiol.2008.046359
- 143.Crawley JN. Behavioral Phenotyping Strategies for Mutant Mice. Neuron. Published online March 2008:809-818. doi:10.1016/j.neuron.2008.03.001
- 144.Levine H, Jørgensen N, Martino-Andrade A, et al. Temporal trends in sperm count: a systematic review and meta-regression analysis. Human Reproduction Update. Published online July 25, 2017:646-659. doi:10.1093/humupd/dmx022
- 145.Travison TG, Araujo AB, O’Donnell AB, Kupelian V, McKinlay JB. A Population-Level Decline in Serum Testosterone Levels in American Men. The Journal of Clinical Endocrinology & Metabolism. Published online January 1, 2007:196-202. doi:10.1210/jc.2006-1375
- 146.Davis GJ, Meyer RK. FSH and LH in the snowshoe hare during the increasing phase of the 10-year cycle. General and Comparative Endocrinology. Published online February 1973:53-60. doi:10.1016/0016-6480(73)90129-9
- 147.Condorelli R, Calogero AE, La Vignera S. Relationship between Testicular Volume and Conventional or Nonconventional Sperm Parameters. International Journal of Endocrinology. Published online 2013:1-6. doi:10.1155/2013/145792
- 148.Erlinge S, Hasselquist D, Svensson M, Frodin P, Nilsson P. Reproductive behaviour of female Siberian lemmings during the increase and peak phase of the lemming cycle. Oecologia. Published online May 3, 2000:200-207. doi:10.1007/s004420051006
- 149.Weiss RV, Clapauch R. Female infertility of endocrine origin. Arq Bras Endocrinol Metab. Published online March 2014:144-152. doi:10.1590/0004-2730000003021
- 150.Boddington B, Didham R. Increases in childlessness in New Zealand. J Pop Research. Published online May 26, 2009:131-151. doi:10.1007/s12546-009-9008-3
- 151.Gobbi PE. A model of voluntary childlessness. J Popul Econ. Published online November 10, 2012:963-982. doi:10.1007/s00148-012-0457-1
- 152.Gurven M, Kaplan H. Longevity Among Hunter- Gatherers: A Cross-Cultural Examination. Population & Development Review. Published online June 2007:321-365. doi:10.1111/j.1728-4457.2007.00171.x
- 153.Erb J, Boyce MS, Stenseth NChr. Population dynamics of large and small mammals. Oikos. Published online January 2001:3-12. doi:10.1034/j.1600-0706.2001.920101.x
- 154.Goodale T, Sadhu A, Petak S, Robbins R. Testosterone and the Heart. Methodist DeBakey Cardiovascular Journal. Published online April 2017:68-72. doi:10.14797/mdcj-13-2-68
- 155.Walther A, Breidenstein J, Miller R. Association of Testosterone Treatment With Alleviation of Depressive Symptoms in Men. JAMA Psychiatry. Published online January 1, 2019:31. doi:10.1001/jamapsychiatry.2018.2734
- 156.Furigo IC, Teixeira PDS, de Souza GO, et al. Growth hormone regulates neuroendocrine responses to weight loss via AgRP neurons. Nat Commun. Published online February 8, 2019. doi:10.1038/s41467-019-08607-1
- 157.A century of trends in adult human height. eLife. Published online July 26, 2016. doi:10.7554/elife.13410
- 158.Vinci L, Floris J, Koepke N, et al. Have Swiss adult males and females stopped growing taller? Evidence from the population-based nutrition survey menuCH, 2014/2015. Economics & Human Biology. Published online May 2019:201-210. doi:10.1016/j.ehb.2019.03.009
- 159.Maric NP, Doknic M, Pavlovic D, et al. Psychiatric and neuropsychological changes in growth hormone-deficient patients after traumatic brain injury in response to growth hormone therapy. J Endocrinol Invest. Published online December 2010:770-775. doi:10.1007/bf03350340
- 160.Akaltun İ, Çayır A, Kara T, Ayaydın H. Is growth hormone deficiency associated with anxiety disorder and depressive symptoms in children and adolescents?: A case-control study. Growth Hormone & IGF Research. Published online August 2018:23-27. doi:10.1016/j.ghir.2018.06.001
- 161.Joseph JJ, Golden SH. Cortisol dysregulation: the bidirectional link between stress, depression, and type 2 diabetes mellitus. Ann NY Acad Sci. Published online October 17, 2016:20-34. doi:10.1111/nyas.13217
- 162.Tsalamandris S, Antonopoulos AS, Oikonomou E, et al. The Role of Inflammation in Diabetes: Current Concepts and Future Perspectives. Eur Cardiol. Published online April 30, 2019:50-59. doi:10.15420/ecr.2018.33.1
- 163.Hackett RA, Kivimäki M, Kumari M, Steptoe A. Diurnal Cortisol Patterns, Future Diabetes, and Impaired Glucose Metabolism in the Whitehall II Cohort Study. The Journal of Clinical Endocrinology & Metabolism. Published online February 2016:619-625. doi:10.1210/jc.2015-2853
- 164.Benoit SR, Hora I, Albright AL, Gregg EW. New directions in incidence and prevalence of diagnosed diabetes in the USA. BMJ Open Diab Res Care. Published online May 2019:e000657. doi:10.1136/bmjdrc-2019-000657
- 165.Magliano DJ, Chen L, Islam RM, et al. Trends in the incidence of diagnosed diabetes: a multicountry analysis of aggregate data from 22 million diagnoses in high-income and middle-income settings. The Lancet Diabetes & Endocrinology. Published online April 2021:203-211. doi:10.1016/s2213-8587(20)30402-2
- 166.Johansson I, Norhammar A. Diabetes and heart failure notions from epidemiology including patterns in low-, middle- and high-income countries. Diabetes Research and Clinical Practice. Published online July 2021:108822. doi:10.1016/j.diabres.2021.108822
- 167.Knudsen JS, Knudsen SS, Hulman A, et al. Changes in type 2 diabetes incidence and mortality associated with introduction of HbA1c as diagnostic option: A Danish 24-year population-based study. The Lancet Regional Health – Europe. Published online March 2022:100291. doi:10.1016/j.lanepe.2021.100291
- 168.BRONSON FH. Mammalian reproductive strategies : genes, photoperiod and latitude. Reprod Nutr Dévelop. Published online 1988:335-347. doi:10.1051/rnd:19880301
- 169.Overbeek J, Nijpels G, Swart K, Blom M, Elders P, Herings R. Type 2 Diabetes, the Epidemic: Trends in Prevalence and Incidence, 2004-2020. DMSO. Published online March 2024:1503-1509. doi:10.2147/dmso.s445288
- 170.Gordon I, Zagoory-Sharon O, Leckman JF, Feldman R. Oxytocin and the Development of Parenting in Humans. Biological Psychiatry. Published online August 2010:377-382. doi:10.1016/j.biopsych.2010.02.005
- 171.Dotti Sani GM, Treas J. Educational Gradients in Parents’ Child-Care Time Across Countries, 1965-2012. Fam Relat. Published online April 19, 2016:1083-1096. doi:10.1111/jomf.12305
- 172.Augustine RA, Ladyman SR, Bouwer GT, et al. Prolactin regulation of oxytocin neurone activity in pregnancy and lactation. J Physiol. Published online March 23, 2017:3591-3605. doi:10.1113/jp273712
- 173.Scott V, Brown CH. Beyond the GnRH Axis: Kisspeptin Regulation of the Oxytocin System in Pregnancy and Lactation. In: Advances in Experimental Medicine and Biology. Springer New York; 2013:201-218. doi:10.1007/978-1-4614-6199-9_10
- 174.Albanesi S, Olivetti C. Gender Roles and Medical Progress. Journal of Political Economy. Published online June 2016:650-695. doi:10.1086/686035
- 175.Ryan AS. The Resurgence of Breastfeeding in the United States. PEDIATRICS. Published online April 1, 1997:e12-e12. doi:10.1542/peds.99.4.e12
- 176.Inoue M, Binns CW, Otsuka K, Jimba M, Matsubara M. Infant feeding practices and breastfeeding duration in Japan: A review. Int Breastfeed J. Published online 2012:15. doi:10.1186/1746-4358-7-15
- 177.Nutrition During Lactation. National Academies Press; 1991. doi:10.17226/1577
- 178.BLANKS A. The role of oxytocin in parturition. BJOG: An International Journal of Obstetrics and Gynaecology. Published online April 2003:46-51. doi:10.1016/s1470-0328(03)00024-7
- 179.Hobbs AJ, Mannion CA, McDonald SW, Brockway M, Tough SC. The impact of caesarean section on breastfeeding initiation, duration and difficulties in the first four months postpartum. BMC Pregnancy Childbirth. Published online April 26, 2016. doi:10.1186/s12884-016-0876-1
- 180.Smith LJ. Impact of Birthing Practices on the Breastfeeding Dyad. Journal of Midwifery & Women’s Health. Published online November 12, 2007:621-630. doi:10.1016/j.jmwh.2007.07.019
- 181.Mitchell IJ, Gillespie SM, Abu-Akel A. Similar effects of intranasal oxytocin administration and acute alcohol consumption on socio-cognitions, emotions and behaviour: Implications for the mechanisms of action. Neuroscience & Biobehavioral Reviews. Published online August 2015:98-106. doi:10.1016/j.neubiorev.2015.04.018
- 182.Bowen MT, Peters ST, Absalom N, Chebib M, Neumann ID, McGregor IS. Oxytocin prevents ethanol actions at δ subunit-containing GABAA receptors and attenuates ethanol-induced motor impairment in rats. Proc Natl Acad Sci USA. Published online February 23, 2015:3104-3109. doi:10.1073/pnas.1416900112
- 183.King CE, Becker HC. Oxytocin attenuates stress-induced reinstatement of alcohol seeking behavior in male and female mice. Psychopharmacology. Published online March 28, 2019:2613-2622. doi:10.1007/s00213-019-05233-z
- 184.King CE, Griffin WC, Lopez MF, Becker HC. Activation of hypothalamic oxytocin neurons reduces binge-like alcohol drinking through signaling at central oxytocin receptors. Neuropsychopharmacol. Published online June 14, 2021:1950-1957. doi:10.1038/s41386-021-01046-x
- 185.Erickson EN, Carter CS, Emeis CL. Oxytocin, Vasopressin and Prolactin in New Breastfeeding Mothers: Relationship to Clinical Characteristics and Infant Weight Loss. J Hum Lact. Published online April 29, 2019:136-145. doi:10.1177/0890334419838225
- 186.Lui C, Cui X gang, Wang Y xin, You Z dong, Xu D feng. Association between neuropeptide oxytocin and male infertility. J Assist Reprod Genet. Published online August 14, 2010:525-531. doi:10.1007/s10815-010-9451-2
- 187.Chester DS, DeWall CN, Derefinko KJ, et al. Looking for reward in all the wrong places: dopamine receptor gene polymorphisms indirectly affect aggression through sensation-seeking. Social Neuroscience. Published online December 7, 2015:487-494. doi:10.1080/17470919.2015.1119191
- 188.Leyton M, Vezina P. Dopamine ups and downs in vulnerability to addictions: a neurodevelopmental model. Trends in Pharmacological Sciences. Published online June 2014:268-276. doi:10.1016/j.tips.2014.04.002
- 189.Gold MS, Blum K, Oscar–Berman M, Braverman ER. Low Dopamine Function in Attention Deficit/Hyperactivity Disorder: Should Genotyping Signify Early Diagnosis in Children? Postgraduate Medicine. Published online January 2014:153-177. doi:10.3810/pgm.2014.01.2735
- 190.Schlüter T, Winz O, Henkel K, et al. The Impact of Dopamine on Aggression: An [18F]-FDOPA PET Study in Healthy Males. J Neurosci. Published online October 23, 2013:16889-16896. doi:10.1523/jneurosci.1398-13.2013
- 191.Tonry M. Why Crime Rates Are Falling throughout the Western World. Crime and Justice. Published online September 2014:1-63. doi:10.1086/678181
- 192.Lappi-Seppälä T, Lehti M. Cross-Comparative Perspectives on Global Homicide Trends. Crime and Justice. Published online September 2014:135-230. doi:10.1086/677979
- 193.Spelman W. Why birth cohorts commit crime at different rates. Social Science Research. Published online August 2021:102628. doi:10.1016/j.ssresearch.2021.102628
- 194.Chistik OF. Statistical Approach To The Research Of Crime In The Russian Federation. Published online March 20, 2019. doi:10.15405/epsbs.2019.03.121
- 195.PORTNOY J, RAINE A, CHEN FR, PARDINI D, LOEBER R, JENNINGS JR. HEART RATE AND ANTISOCIAL BEHAVIOR: THE MEDIATING ROLE OF IMPULSIVE SENSATION SEEKING. Criminology. Published online April 9, 2014:292-311. doi:10.1111/1745-9125.12038
- 196.Baker LA, Tuvblad C, Reynolds C, Zheng M, Lozano DI, Raine A. Resting heart rate and the development of antisocial behavior from age 9 to 14: Genetic and environmental influences. Dev Psychopathol. Published online July 7, 2009:939-960. doi:10.1017/s0954579409000509
- 197.Latvala A, Kuja-Halkola R, Almqvist C, Larsson H, Lichtenstein P. A Longitudinal Study of Resting Heart Rate and Violent Criminality in More Than 700 000 Men. JAMA Psychiatry. Published online October 1, 2015:971. doi:10.1001/jamapsychiatry.2015.1165
- 198.Murray J, Hallal PC, Mielke GI, et al. Low resting heart rate is associated with violence in late adolescence: a prospective birth cohort study in Brazil. Int J Epidemiol. Published online January 28, 2016:491-500. doi:10.1093/ije/dyv340
- 199.Culpepper L, Froom J. Incarceration and blood pressure. Social Science & Medicine Part A: Medical Psychology & Medical Sociology. Published online December 1980:571-574. doi:10.1016/s0271-7123(80)80064-2
- 200.Raine A, Choy O, Achenbach T, Liu J. High resting heart rate protects against the intergenerational transmission of antisocial behavior: a birth cohort study. Eur Child Adolesc Psychiatry. Published online June 23, 2023:1597-1603. doi:10.1007/s00787-023-02247-z
- 201.Ziegler M, Kennedy B, Holland O, Murphy D, Lake C. The effects of dopamine agonists on human cardiovascular and sympathetic nervous systems. Int J Clin Pharmacol Ther Toxicol. 1985;23(4):175-179. https://www.ncbi.nlm.nih.gov/pubmed/3158615
- 202.Tiihonen J, Halonen P, Tiihonen L, Kautiainen H, Storvik M, Callaway J. The Association of Ambient Temperature and Violent Crime. Sci Rep. Published online July 28, 2017. doi:10.1038/s41598-017-06720-z
- 203.Fares A. Winter Hypertension : Potential Mechanisms. IJHS. Published online June 2013:210-219. doi:10.12816/0006044
- 204.Eisenberg DP, Kohn PD, Baller EB, Bronstein JA, Masdeu JC, Berman KF. Seasonal Effects on Human Striatal Presynaptic Dopamine Synthesis. Journal of Neuroscience. Published online November 3, 2010:14691-14694. doi:10.1523/jneurosci.1953-10.2010
- 205.Meng Y, Holmes J, Hill-McManus D, Brennan A, Meier PS. Trend analysis and modelling of gender-specific age, period and birth cohort effects on alcohol abstention and consumption level for drinkers in Great Britain using the General Lifestyle Survey 1984-2009. Addiction. Published online September 13, 2013:206-215. doi:10.1111/add.12330
- 206.Matthiopoulos J, Moss R, Lambin X. The kin facilitation hypothesis for red grouse population cycles: territorial dynamics of the family cluster. Ecological Modelling. Published online January 2002:291-307. doi:10.1016/s0304-3800(01)00420-3
- 207.PIERTNEY SB, LAMBIN X, MACCOLL ADC, et al. Temporal changes in kin structure through a population cycle in a territorial bird, the red grouse Lagopus lagopus scoticus. Molecular Ecology. Published online April 22, 2008:2544-2551. doi:10.1111/j.1365-294x.2008.03778.x
- 208.Hamati R, Ahrens J, Shvetz C, Holahan MR, Tuominen L. 65 years of research on dopamine’s role in classical fear conditioning and extinction: A systematic review. Eur J of Neuroscience. Published online October 17, 2023:1099-1140. doi:10.1111/ejn.16157
- 209.Vuorre M, Przybylski AK. Global Well-Being and Mental Health in the Internet Age. Clinical Psychological Science. Published online November 27, 2023. doi:10.1177/21677026231207791
- 210.Joensson M, Thomsen KR, Andersen LM, et al. Making sense: Dopamine activates conscious self‐monitoring through medial prefrontal cortex. Human Brain Mapping. Published online January 27, 2015:1866-1877. doi:10.1002/hbm.22742
- 211.Mitchell RLC, Phillips LH. The psychological, neurochemical and functional neuroanatomical mediators of the effects of positive and negative mood on executive functions. Neuropsychologia. Published online January 2007:617-629. doi:10.1016/j.neuropsychologia.2006.06.030
- 212.Harcourt BE. From the Asylum to the Prison: Rethinking the Incarceration Revolution. SSRN Journal. Published online 2006. doi:10.2139/ssrn.881865
- 213.Frazier BD, Sung HE, Gideon L, Alfaro KS. The impact of prison deinstitutionalization on community treatment services. Health Justice. Published online May 6, 2015. doi:10.1186/s40352-015-0021-7
- 214.Previc FH. The Dopaminergic Mind in Human Evolution and History. Published online 2009. doi:10.1017/cbo9780511581366
- 215.Raghanti MA, Edler MK, Stephenson AR, et al. A neurochemical hypothesis for the origin of hominids. Proc Natl Acad Sci USA. Published online January 22, 2018:E1108-E1116. doi:10.1073/pnas.1719666115
- 216.Johnsen K, Devineau O, Andreassen HP. Phase- and season-dependent changes in social behaviour in cyclic vole populations. BMC Ecol. Published online January 25, 2019. doi:10.1186/s12898-019-0222-3
- 217.Settle JE, Dawes CT, Christakis NA, Fowler JH. Friendships Moderate an Association between a Dopamine Gene Variant and Political Ideology. The Journal of Politics. Published online October 2010:1189-1198. doi:10.1017/s0022381610000617
- 218.Ebstein RP, Monakhov MV, Lu Y, Jiang Y, Lai PS, Chew SH. Association between the dopamine D4 receptor gene exon III variable number of tandem repeats and political attitudes in female Han Chinese. Proc R Soc B. Published online August 22, 2015:20151360. doi:10.1098/rspb.2015.1360
- 219.COCHRANE C. Left and Right. Published online October 1, 2015. doi:10.2307/j.ctvnjbgwt
- 220.Cardoso C, Ellenbogen MA, Linnen AM. Acute intranasal oxytocin improves positive self-perceptions of personality. Psychopharmacology. Published online October 20, 2011:741-749. doi:10.1007/s00213-011-2527-6
- 221.Pearce E, Wlodarski R, Machin A, Dunbar RIM. Genetic Influences on Social Relationships: Sex Differences in the Mediating Role of Personality and Social Cognition. Adaptive Human Behavior and Physiology. Published online November 26, 2019:331-351. doi:10.1007/s40750-019-00120-5
- 222.Joly JK, Hofmans J, Loewen P. Personality and Party Ideology Among Politicians. A Closer Look at Political Elites From Canada and Belgium. Front Psychol. Published online April 17, 2018. doi:10.3389/fpsyg.2018.00552
- 223.Tollenaar MS, Chatzimanoli M, van der Wee NJA, Putman P. Enhanced orienting of attention in response to emotional gaze cues after oxytocin administration in healthy young men. Psychoneuroendocrinology. Published online September 2013:1797-1802. doi:10.1016/j.psyneuen.2013.02.018
- 224.Dodd MD, Hibbing JR, Smith KB. The politics of attention: gaze-cuing effects are moderated by political temperament. Atten Percept Psychophys. Published online November 4, 2010:24-29. doi:10.3758/s13414-010-0001-x
- 225.Insel TR, Young L, Witt DM, Crews D. Gonadal Steroids have Paradoxical Effects on Brain Oxytocin Receptors. J Neuroendocrinol. Published online December 1993:619-628. doi:10.1111/j.1365-2826.1993.tb00531.x
- 226.Hatemi PK, Medland SE, Klemmensen R, et al. Genetic Influences on Political Ideologies: Twin Analyses of 19 Measures of Political Ideologies from Five Democracies and Genome-Wide Findings from Three Populations. Behav Genet. Published online February 26, 2014:282-294. doi:10.1007/s10519-014-9648-8
- 227.Gimpel JG, Lovin N, Moy B, Reeves A. The Urban–Rural Gulf in American Political Behavior. Polit Behav. Published online March 5, 2020:1343-1368. doi:10.1007/s11109-020-09601-w
- 228.Hurlemann R, Marsh N, Schultz J, Scheele D. Oxytocin shapes the priorities and neural representations of attitudes and values. Behav Brain Sci. Published online 2017. doi:10.1017/s0140525x16000807
- 229.Taber CS, Lodge M. The Illusion of Choice in Democratic Politics: The Unconscious Impact of Motivated Political Reasoning. Political Psychology. Published online January 22, 2016:61-85. doi:10.1111/pops.12321
- 230.Stanley DA, Adolphs R. Toward a Neural Basis for Social Behavior. Neuron. Published online October 2013:816-826. doi:10.1016/j.neuron.2013.10.038
- 231.Zur R. Stuck in the middle: Ideology, valence and the electoral failures of centrist parties. Brit J Polit Sci. Published online September 25, 2019:706-723. doi:10.1017/s0007123419000231
- 232.Young S. The neurobiology of human social behaviour: an important but neglected topic. J Psychiatry Neurosci. 2008;33(5):391-392. https://www.ncbi.nlm.nih.gov/pubmed/18787656
- 233.Whitehead H, Laland KN, Rendell L, Thorogood R, Whiten A. The reach of gene–culture coevolution in animals. Nat Commun. Published online June 3, 2019. doi:10.1038/s41467-019-10293-y
- 234.Geng Y, Zhao W, Zhou F, et al. Oxytocin Enhancement of Emotional Empathy: Generalization Across Cultures and Effects on Amygdala Activity. Front Neurosci. Published online July 31, 2018. doi:10.3389/fnins.2018.00512
- 235.Buffone AEK, Poulin MJ. Empathy, Target Distress, and Neurohormone Genes Interact to Predict Aggression for Others–Even Without Provocation. Pers Soc Psychol Bull. Published online September 10, 2014:1406-1422. doi:10.1177/0146167214549320
- 236.Grillon C, Krimsky M, Charney DR, Vytal K, Ernst M, Cornwell B. Oxytocin increases anxiety to unpredictable threat. Mol Psychiatry. Published online November 13, 2012:958-960. doi:10.1038/mp.2012.156
- 237.Kawada A, Nagasawa M, Murata A, et al. Vasopressin enhances human preemptive strike in both males and females. Sci Rep. Published online July 4, 2019. doi:10.1038/s41598-019-45953-y
- 238.Everett JAC, Faber NS, Crockett M. Preferences and beliefs in ingroup favoritism. Front Behav Neurosci. Published online February 13, 2015. doi:10.3389/fnbeh.2015.00015
- 239.Huang Y, Zhen S, Yu R. Distinct neural patterns underlying ingroup and outgroup conformity. Proc Natl Acad Sci USA. Published online February 19, 2019:4758-4759. doi:10.1073/pnas.1819421116
- 240.Sinclair ARE. Mammal population regulation, keystone processes and ecosystem dynamics. Phil Trans R Soc Lond B. Published online August 28, 2003:1729-1740. doi:10.1098/rstb.2003.1359